Schedule
Schedule Overview
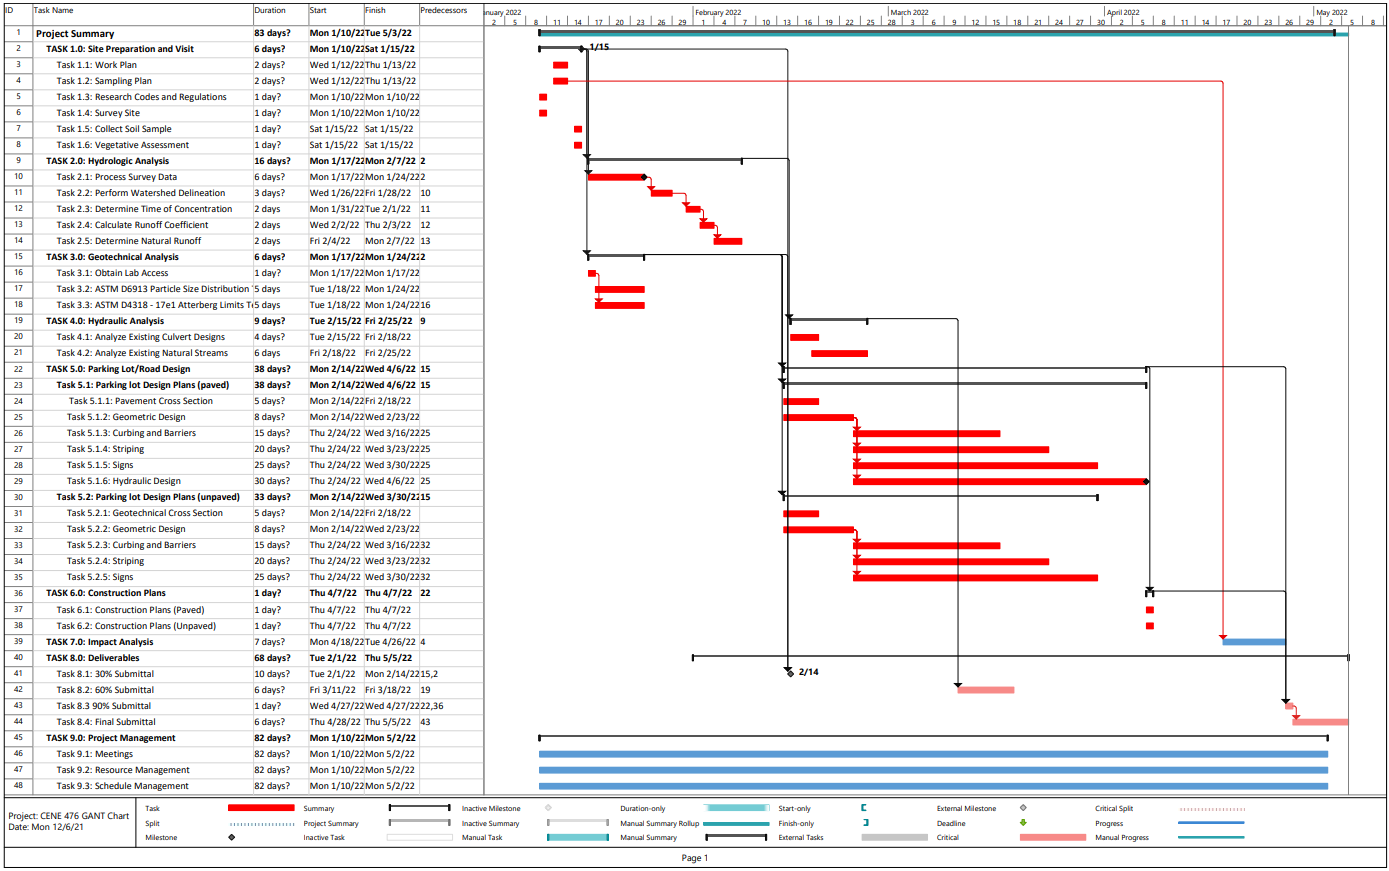
The project schedule is an overview of the scope of services that will be completed for the project. The Gantt chart can be seen in the Appendix. The project will last from Early January to early May, the exact dates for the project is from January 10th, 2021 through April 29th, 2021. The total working time for the project is 82 days. Major tasks of the project include the site visit, hydrologic analysis, geotechnical analysis, hydraulic analysis, parking lot design plans, project management and Impact analysis.
Major Deliverables
There are four major deliverables to the project. The first is the 30 percent submittal. A 30 percent report along with a presentation to show progress. Task 1.0 through 3.0 should have been completed by this point and the parking lot design plans shall have been started. The next deliverable is the 60 percent submittal. By this point all tasks must have been started and the plans should be 60 percent complete. A report along with a presentation on progress is due. Next is the 90 percent submittal. All tasks should be completed at this point and the report should be a final rough draft along with the plans. The final submission should include the final report along with a final presentation. Lastly, constructions and maintenance plans shall be provided to the client.
Critical Path
The critical path is identified by the task bars that are red in the Gantt chart. The critical path includes the tasks that need to be completed in order for the project to finish on time. If the critical tasks are not completed on time this could impact the project completion date. Task 1.0: Site visit is a crucial critical task. The data collection must be done in order to provide correct plans for the client. Task 5.0: Parking Lot Design is also a critical task as it needs to be completed in order to start Task 6.0. With this being towards the end of the project it is critical that task 5 is completed on time. In order to remain on schedule each task is noted in Appendix A in the Gantt Chart. Float time for critical tasks is provided to allow for any challenges that arise.
