Rainwater Harvesting at the NAU ARD Building
Rainwater Harvesting at the NAU ARD Building
Precipitation Analysis
Flagstaff, AZ general climate background
Flagstaff, Arizona is located in the northern part of the state at an elevation of 7,000 ft. The city is situated at the base of the San Francisco Peaks which reach an elevation of over 12,000 ft. Flagstaff’s four seasons provide a variety of different weather conditions. During the winter, there is snow and cold weather. In July the temperature averages 82.2 °F. There are two wet seasons in Flagstaff. The winter precipitation extends from November to April. In the summer, the monsoon season is in July and August.
Precipitation Data
Precipitation data for this study draws averages gathered from station Flagstaff 4 SW, Arizona, as well as other NOAA resources regarding intensity of storms and precipitation extremes. The period of record for the average precipitation measurements was between 5/1/1984 to 9/30/2010.
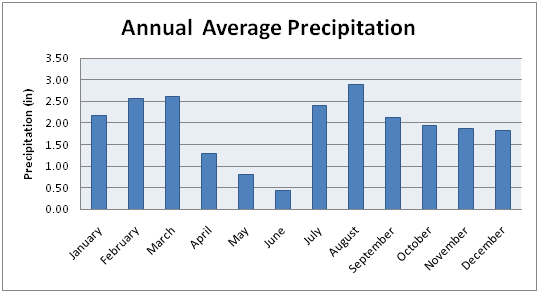
Figure 3 Annual Mean Precipitations
For the months of May and June, which represent the period when the gardens need to be planted, the average rainfall is only 0.57 in. and 0.41 in. respectively. The wettest month of the year is August which averages 3.54 inches of rain annually. This however falls at the end of the gardening season. In order to have water available it will have to be collected and stored throughout the winter months, which averages between 1 and 2.5 inches. The total annual precipitation averages 12.57 in. annually.
In order to determine maximum amounts of rainwater that could be collected, we looked at record rainfalls for each month. The size of the tank and the flow-rates will be based on expected maximums, so the design can handle the higher flows. In addition, in wetter seasons more water can be collected and stored for use when it is needed.
Using the site location information, the precipitations data necessary were obtained from the National Oceanic and Atmospheric Administration (NOAA). Precipitation frequency (PF) estimates for the site location is listed in Table 1 and the depth-duration-frequency (DDF) curves graphs are shown in Figure 4 and 5, the data generated from NOAA website is based on frequency analysis of partial duration series (PDS).
Table 1 Precipitation Frequency (PF) Estimates
|
Precipitation Frequency Estimates (inches) |
||||||||||
|
Duration |
Average recurrence interval (years) |
|||||||||
|
1 |
2 |
5 |
10 |
25 |
50 |
100 |
200 |
500 |
1000 |
|
|
5-min |
0.21 |
0.27 |
0.36 |
0.44 |
0.55 |
0.65 |
0.75 |
0.86 |
1.02 |
1.16 |
|
10-min |
0.32 |
0.41 |
0.55 |
0.67 |
0.84 |
0.98 |
1.14 |
1.31 |
1.55 |
1.76 |
|
15-min |
0.39 |
0.51 |
0.69 |
0.83 |
1.05 |
1.22 |
1.41 |
1.62 |
1.92 |
2.18 |
|
30-min |
0.53 |
0.69 |
0.92 |
1.12 |
1.41 |
1.65 |
1.9 |
2.18 |
2.59 |
2.94 |
|
60-min |
0.65 |
0.85 |
1.14 |
1.39 |
1.74 |
2.04 |
2.35 |
2.7 |
3.21 |
3.64 |
|
2-hr |
0.77 |
0.97 |
1.29 |
1.54 |
1.93 |
2.24 |
2.59 |
2.97 |
3.53 |
4 |
|
3-hr |
0.85 |
1.07 |
1.38 |
1.64 |
2.02 |
2.33 |
2.68 |
3.06 |
3.62 |
4.09 |
|
6-hr |
1.03 |
1.28 |
1.59 |
1.86 |
2.25 |
2.57 |
2.92 |
3.3 |
3.85 |
4.3 |
|
12-hr |
1.33 |
1.64 |
2 |
2.31 |
2.72 |
3.04 |
3.37 |
3.72 |
4.22 |
4.64 |
|
24-hr |
1.68 |
2.1 |
2.61 |
3.03 |
3.6 |
4.05 |
4.53 |
5.01 |
5.67 |
6.19 |
|
2-day |
2 |
2.5 |
3.11 |
3.61 |
4.3 |
4.84 |
5.41 |
5.99 |
6.8 |
7.43 |
|
3-day |
2.17 |
2.7 |
3.38 |
3.93 |
4.71 |
5.32 |
5.97 |
6.64 |
7.58 |
8.32 |
|
4-day |
2.33 |
2.91 |
3.65 |
4.26 |
5.12 |
5.8 |
6.53 |
7.29 |
8.36 |
9.21 |
|
7-day |
2.79 |
3.48 |
4.32 |
5.03 |
6.01 |
6.79 |
7.62 |
8.48 |
9.67 |
10.62 |
|
10-day |
3.18 |
3.95 |
4.88 |
5.61 |
6.61 |
7.38 |
8.17 |
8.97 |
10.05 |
10.88 |
|
20-day |
4.25 |
5.27 |
6.39 |
7.25 |
8.36 |
9.18 |
9.98 |
10.76 |
11.76 |
12.5 |
|
30-day |
5.18 |
6.42 |
7.75 |
8.75 |
10.04 |
10.97 |
11.89 |
12.77 |
13.88 |
14.68 |
|
45-day |
6.23 |
7.71 |
9.32 |
10.56 |
12.17 |
13.36 |
14.53 |
15.66 |
17.12 |
18.19 |
|
60-day |
7.29 |
9.02 |
10.83 |
12.17 |
13.86 |
15.08 |
16.25 |
17.36 |
18.74 |
19.73 |
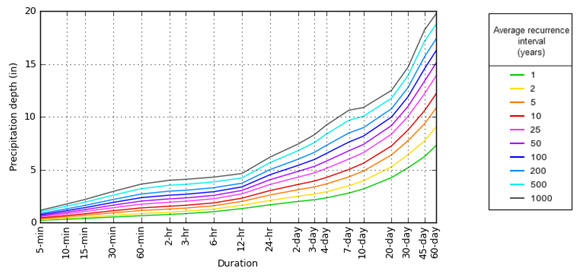
Figure 4 Precipitation depth versus duration
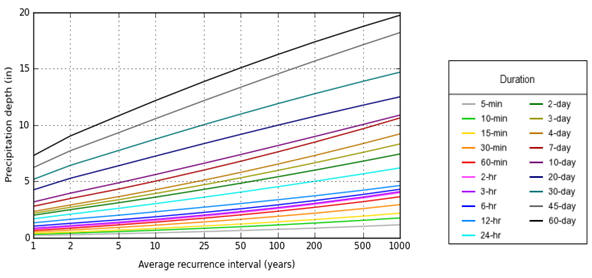
Figure 5 Precipitation depth versus average recurrence interval
Outcomes
After further analysis, this data will be used to determine the volume of the rainwater collection tank. This will be determined by using a relevant depth of water that can be collected annually. This combined with the data from the rooftop analysis will show how much water can be stored. Further analysis of the gardening area and water consumption will show how much water will be required for use in the community garden. A final volume will result from a number of factors including how much water is potentially available, how much is needed, and the cost to store a given amount of water.