| |
DESIGN Method |
|
|
|
|
|
FORCES |
|
| |
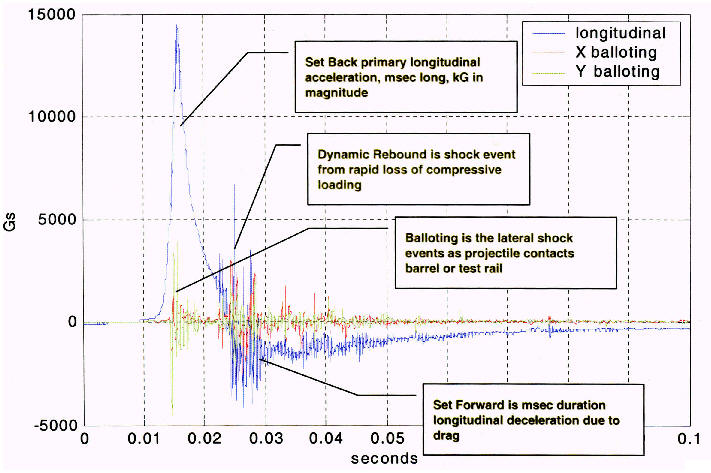
The acceleration values that act on the mechanism during launch were
taken from the Rail Gun Acceleration Time Histories (Figure 1.0) graph
shown below provided by Raytheon. These values were acquired by
measuring the forces when launched from a 155mm Howitzer with "soft
catch" capabilities. |
|
| |
|
|
| |
Figure 1.0 - Rail Gun Acceleration Time Histories |
|
| |
 |
|
|
|
|
| |
The launch accelerations are treated as DC acceleration of: Set Back =
10,000G, Balloting = 3,300G, and Set Forward = 2,000G. Set Back is the
initial compression of the device upon the launching explosion acting
normal to the mechanism . Balloting is the vibration of the projectile
as it travels through the launch tube, coming in contact with the tube
walls and is considered in plane with the lens and mechanism. Set
Forward is a rebound occurring as a result of the initial launch
acceleration and results normal to the mechanism in the opposite
direction of the Set Back.
During flight and
mechanism operations, the accelerations are greatly reduced. The
following forces were specified by the client: Lateral Acceleration
0-3G, Lateral Vibration 5G. |
|
| |
|
|
| |
ANALYSIS |
|
| |
The analysis of the design
is limited to static linear analysis due to time restraints. Success
in ductile components by Raytheon is defined as:
- Permanent
deformation of optical surfaces are within tolerances defined by the
optical engineer
- Permanent
deformation of support structures for the optical and antenna
elements does not result in displacements of the elements greater
than their allocated tolerances
- No interference may
occur with other components
- No ultimate failures
may occur with the device
- Allocations may be
made for plastic deformation at launch
Analysis methods used
include hand stress calculations in critical areas using Von Mises
stresses. Finite Element Analysis was used in the analysis of the
positioning arm. |
|
| |
|
|
|
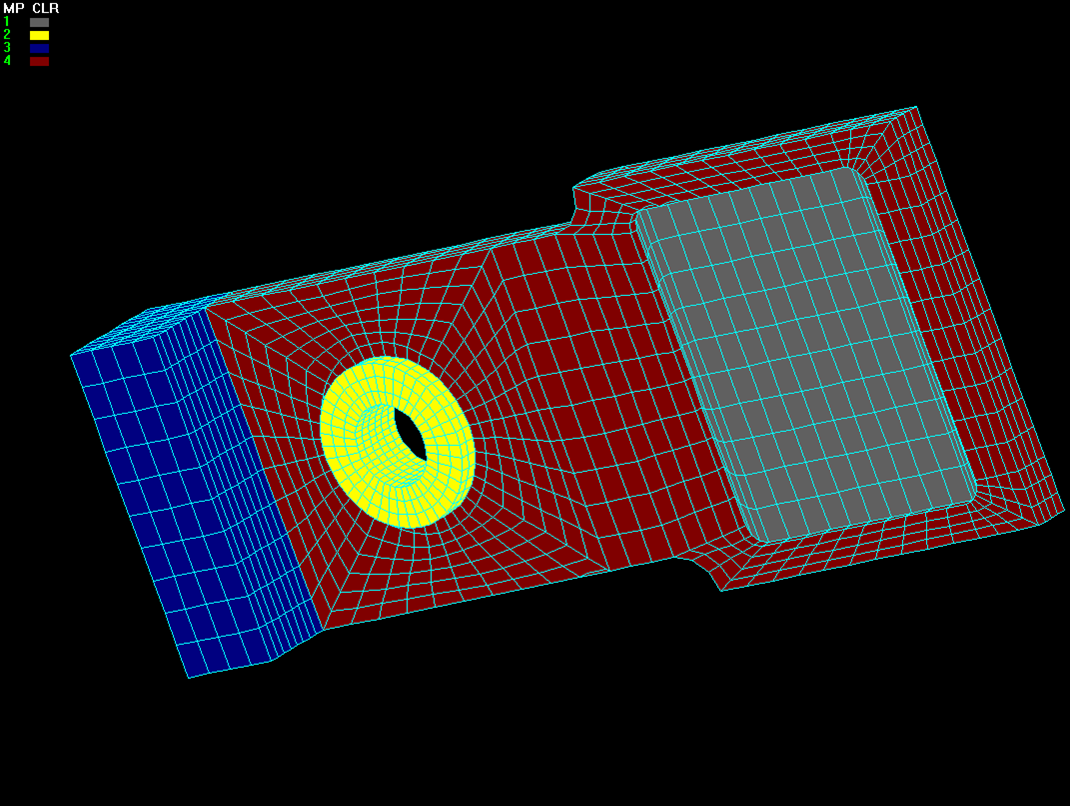
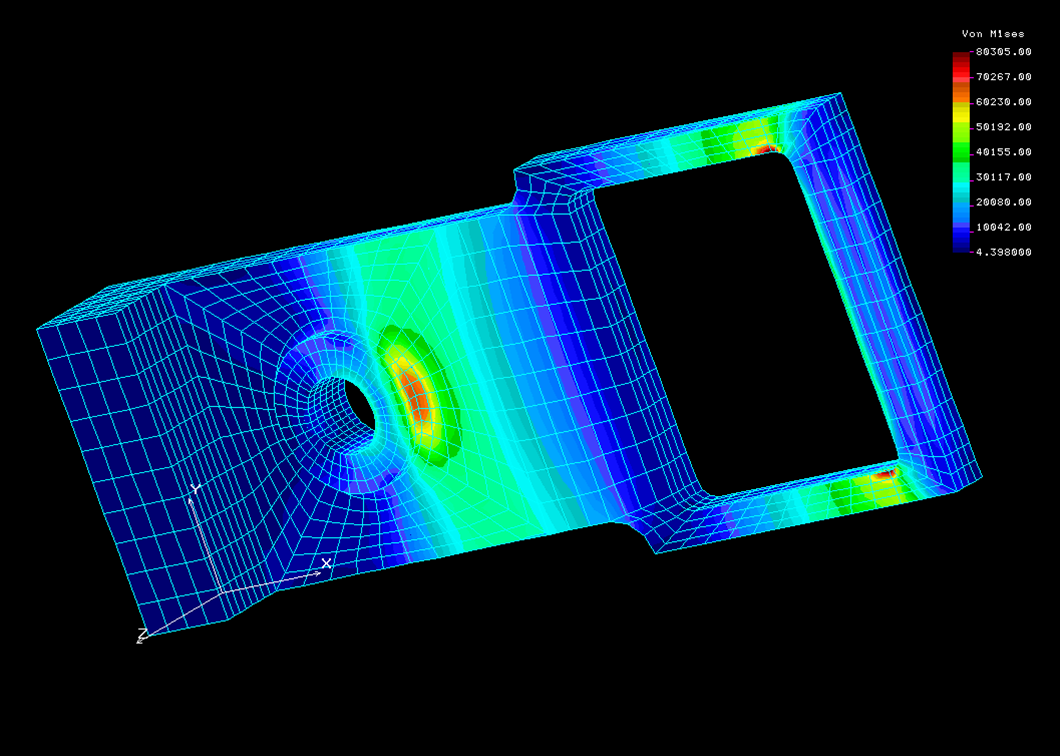
Figure 2.0 - A capture of the FEA mesh for positioning arm, counter
balance, lens, and bushing using COSMOS/M software. Also a plot of the
Von Mises stress of the components under 10KG static loading. |
|
|
  |
|
| |
|
|
|
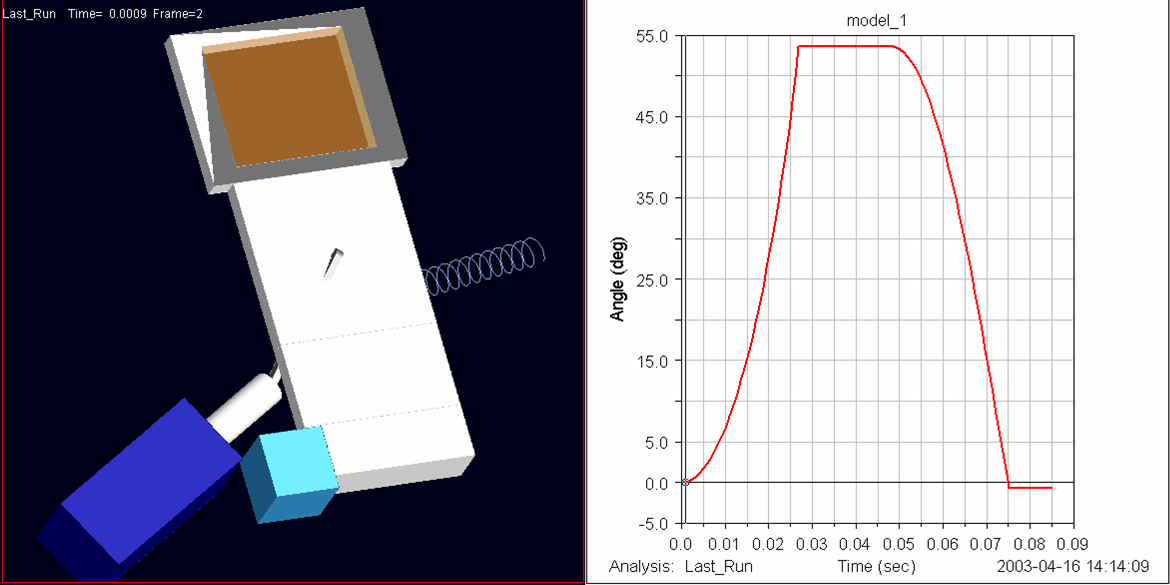
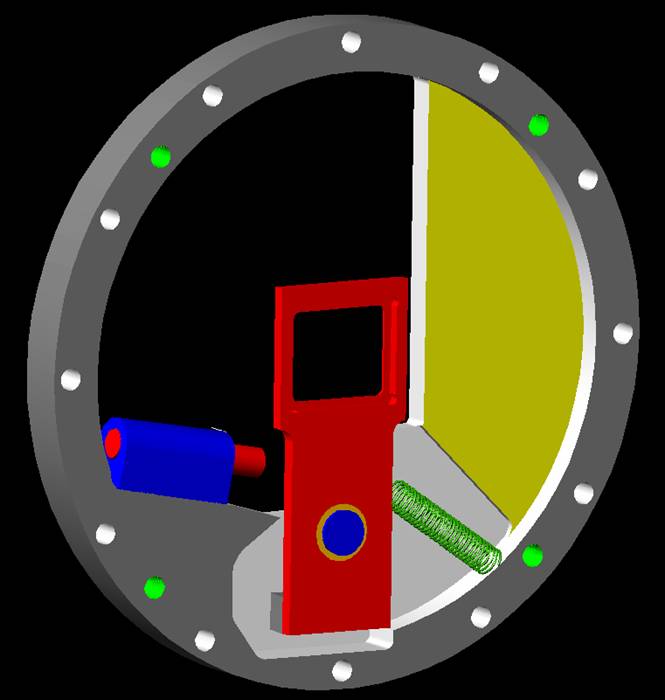
Adam's Dynamic Analysis software was used to analyze and model the
movement of the positioning arm during different loading cases. The
actuation time for the solenoid was determined to be 0.027 seconds,
and the spring return time was 0.028 seconds. Below is a capture of
the Adam's model during the mechanism actuation. An angle vs. time
graph is shown and helps show how the actuation times were determined. |
|
| |
|
|
|
Figure 2.1 - Adam's model of mechanism movement and angle vs. time
graph. By Clicking Here
or on the picture below, a small AVI file will play, showing the
movement of the arm. |
|
|
 |
|
| |
|
|
| |
PROTOTYPE |
|
|
A drawing of the final
prototype and components was created using Mechanical Desktop 6 and is seen below in Figure 2.0. |
|
|
|
|
| |
Figure 2.0 - Final Prototype CAD Drawing |
|
| |
 |
|
|
|
|