Progress
Gantt Chart
Above is the gantt chart schedule for the remainder of our team's capstone project. This chart gives a good idea of the schedule and goals of our team over the Spring semester. To begin, assembly of the project is ending on January 29th, 2021. This step includes assembling all parts we recieved from purchasing into individual modules. This step does not include final assembly or creation of an enclosure. 3D modeling is the next step and the measurements for the enclosure's model ended on January 14, 2021. Creation and fine tuning of the final model is still in progress.
Software development is a stage that begun December 8th, 2021 and end on Feburary 26th, 2021. The software development phase is creating a program for our ESP microcontroller and creation of a database on a sever. The server will include a GUI and external website to allow the client to visualize sensor data from the ESP microcontroller.
Final project assembly will begin on Feburary 10th, 2021 and end on March 12th, 2021. This phase is the assembly of all sensors, microcontrollers, and power systems into the enclosures we will have designed for the project. This phase has a long time range to allow us room if the enclosure needs final touches. It will also allow our team to have additional time to reprint enclosures on a 3D printer as needed.
The final two phases are final testing and the project finish date. Final testing will occur from March 1st, 2021 to March 31st, 2021. Final testing should not contain any major modifications to our project. This phase will be simply setting up each module into its corresponding greenhouse and ensuring data is collected from the sensors. Some tweaks may need to be done to the GUI and server, but hardware modifications should not be needed at this point. The project finish date is aimed to be April 1st, 2021. No further modifcations or testing should occur past this date. Past this date out team will go into the documentation stage of our capstone project.
Gantt Chart Progress
For the current progress compared to the gantt chart we are currently finished with the installation and have finished off all setup and final testing. The project has been completed and has satisfied our clients requests. We have completed the last of the documentation, and within the next week we will be completed with the class.
Testing
Our testing phase has many parts and we have already began testing on most of them. The first test is our power circuit. We are testing this by comparing the power draw to the power generated by the solar panel. The battery's charge level can be found by the native voltage measured by the battery. The second part of testing is finding the accuracy and reliability of the sensor data to the esp modules. This testing can be done by artificially producing the enviroments for the sensors in an expected range at different values, then let the sensors read the area and we will see if their readings coorespond to the margin of error expected. The Third part of testing will involve direct connectivity between the esp module and the raspberry pi server to test the data stream between them and additionally the data stream to the website. The testing would just involve sending packets of data and them posting them untill we design a graphing utility. The fourth part of testing is the full integration of the modules and the water testing in a non artificial enviroment such as in the green house, The testing would involve short term deployments and checkups to see that the circuit is still functioning and has not overtaken too much water, if it fails further revisions will have to be made.
Sensor Current Usage Testing

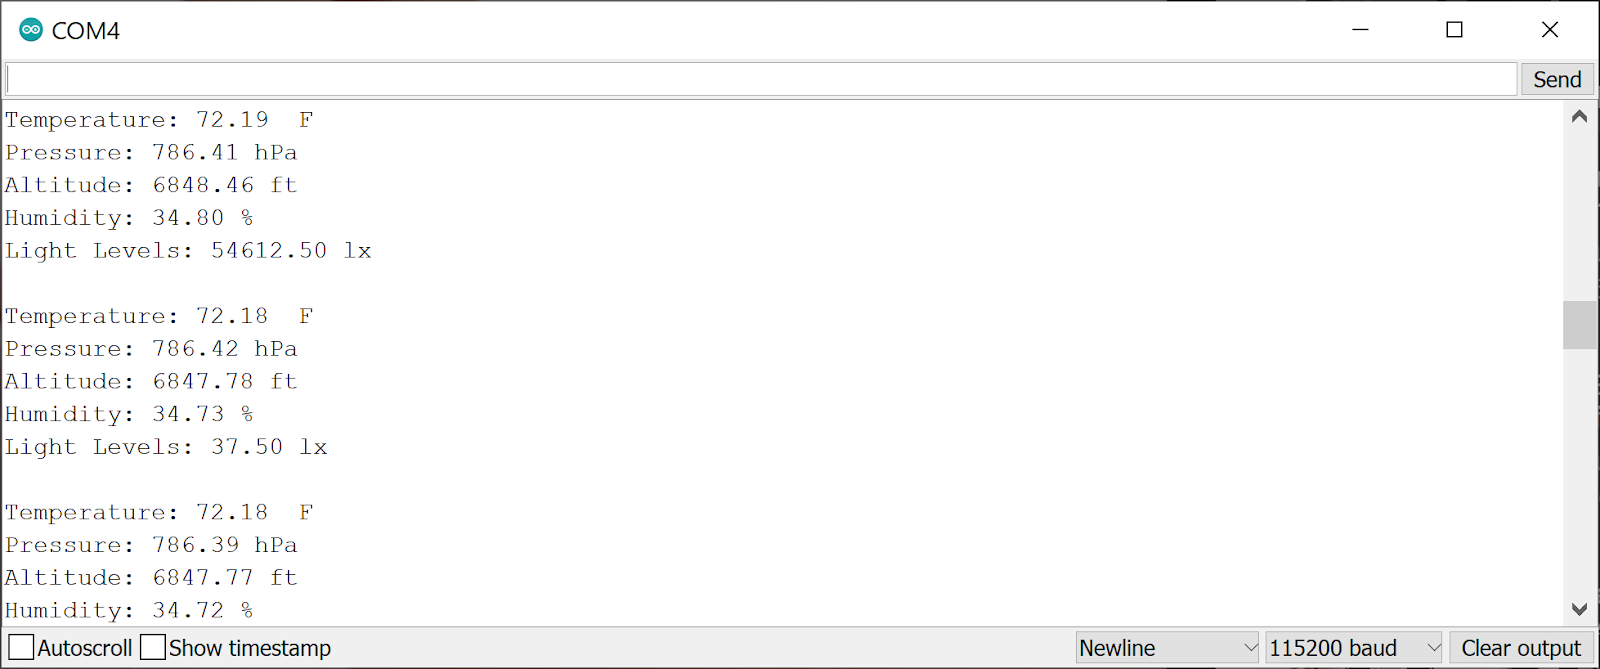
Communication Port of the ESP8266
Below is our results from testing the current usage of the ESP8266, BME280, and BH1750 when measuring sensor data. This test was done by cutting open a microusb cable and attaching a mutlimeter in series to the ESP8266 and sensors. By doing this we can calculate how much our solar pannel will need to supply and a general estimate of how often we can pull data from the sensors.

Multimeter Current Usage
From our testing we can see an max current usage of 87.2 milliamps. With the 3000 mAh 18650 cell we are using this will last approximately 34 hours constantly reading sensor data. We will only be collecting data on a time interval and not continously. On top of this, our team has chosen a 150mA solar pannel to charge the battery. Taking both of these facts into consideration, our team has concluded that each ESP8266 and sensor modules will be able to self-sustain requiring no user interaction.