
Our Sponsors

Dr. David Trevas is our NAU faculty sponsor and mentor for this project.
Project Images
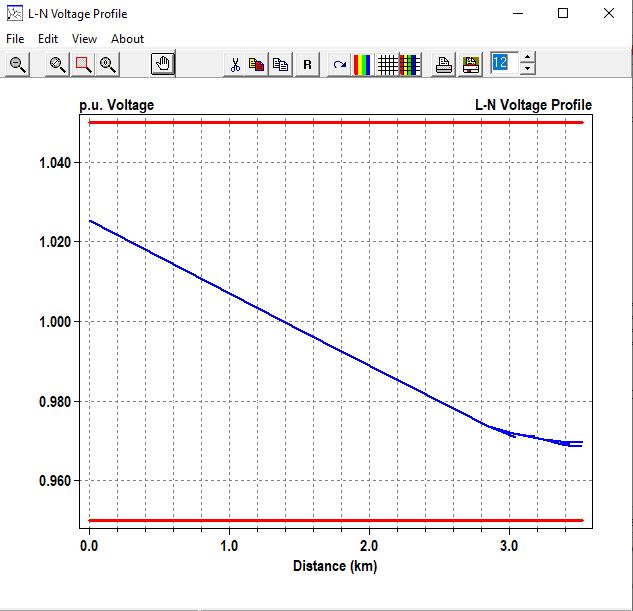
Figure 1: Sample OpenDSS output data representing line losses within our distribution system.
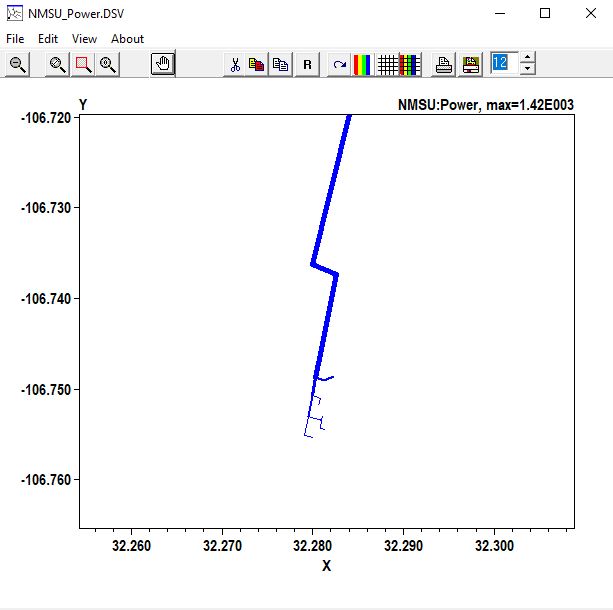
Figure 2: Sample OpenDSS output data representing the transmission backbone and delivery lines over the entire distribution system.
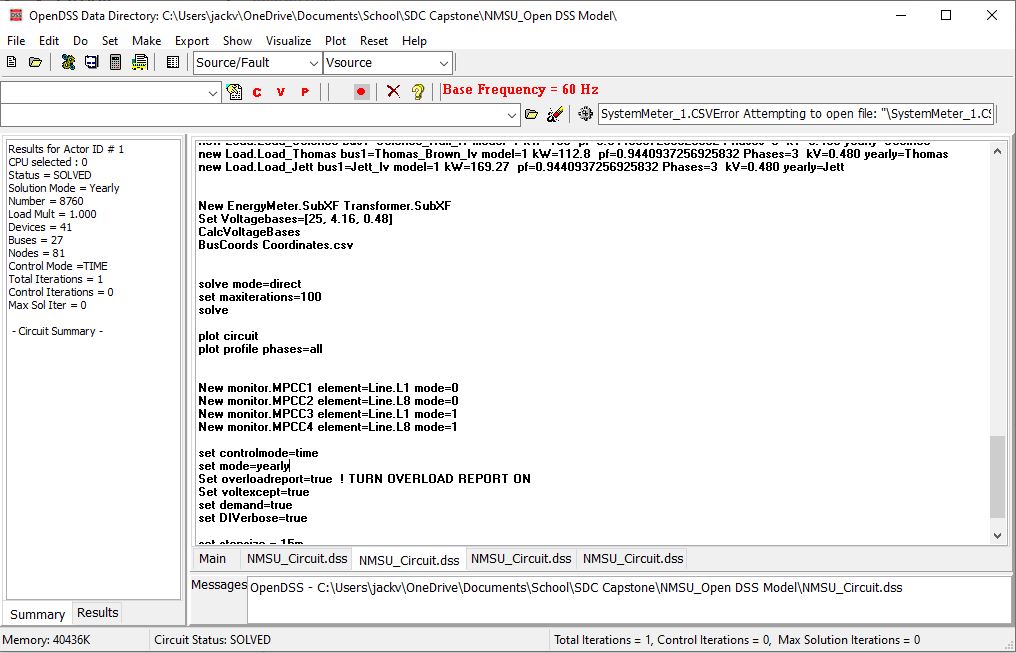
Figure 3: OpenDSS GUI and code sample.
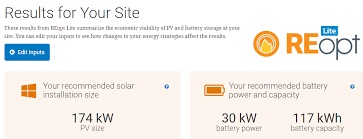
Figure 4: Example ReOPT Lite system assessment results.
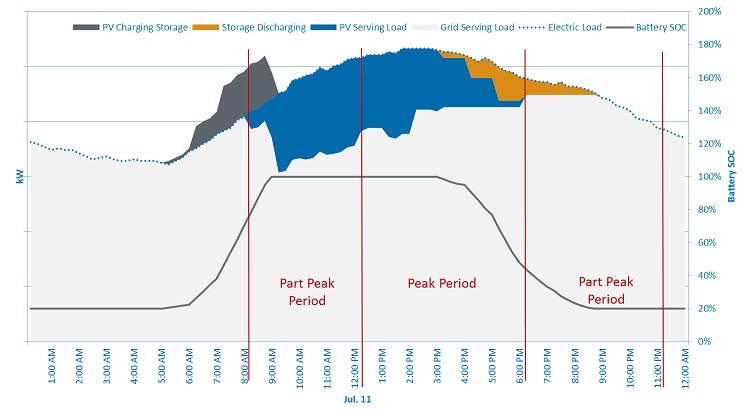
Figure 5: Sample ReOPT Lite battery analysis results .
Dr. David Trevas is our NAU faculty sponsor and mentor for this project.
Project Images
Figure 1: Sample OpenDSS output data representing line losses within our distribution system.
Figure 2: Sample OpenDSS output data representing the transmission backbone and delivery lines over the entire distribution system.
Figure 3: OpenDSS GUI and code sample.
Figure 4: Example ReOPT Lite system assessment results.
Figure 5: Sample ReOPT Lite battery analysis results .