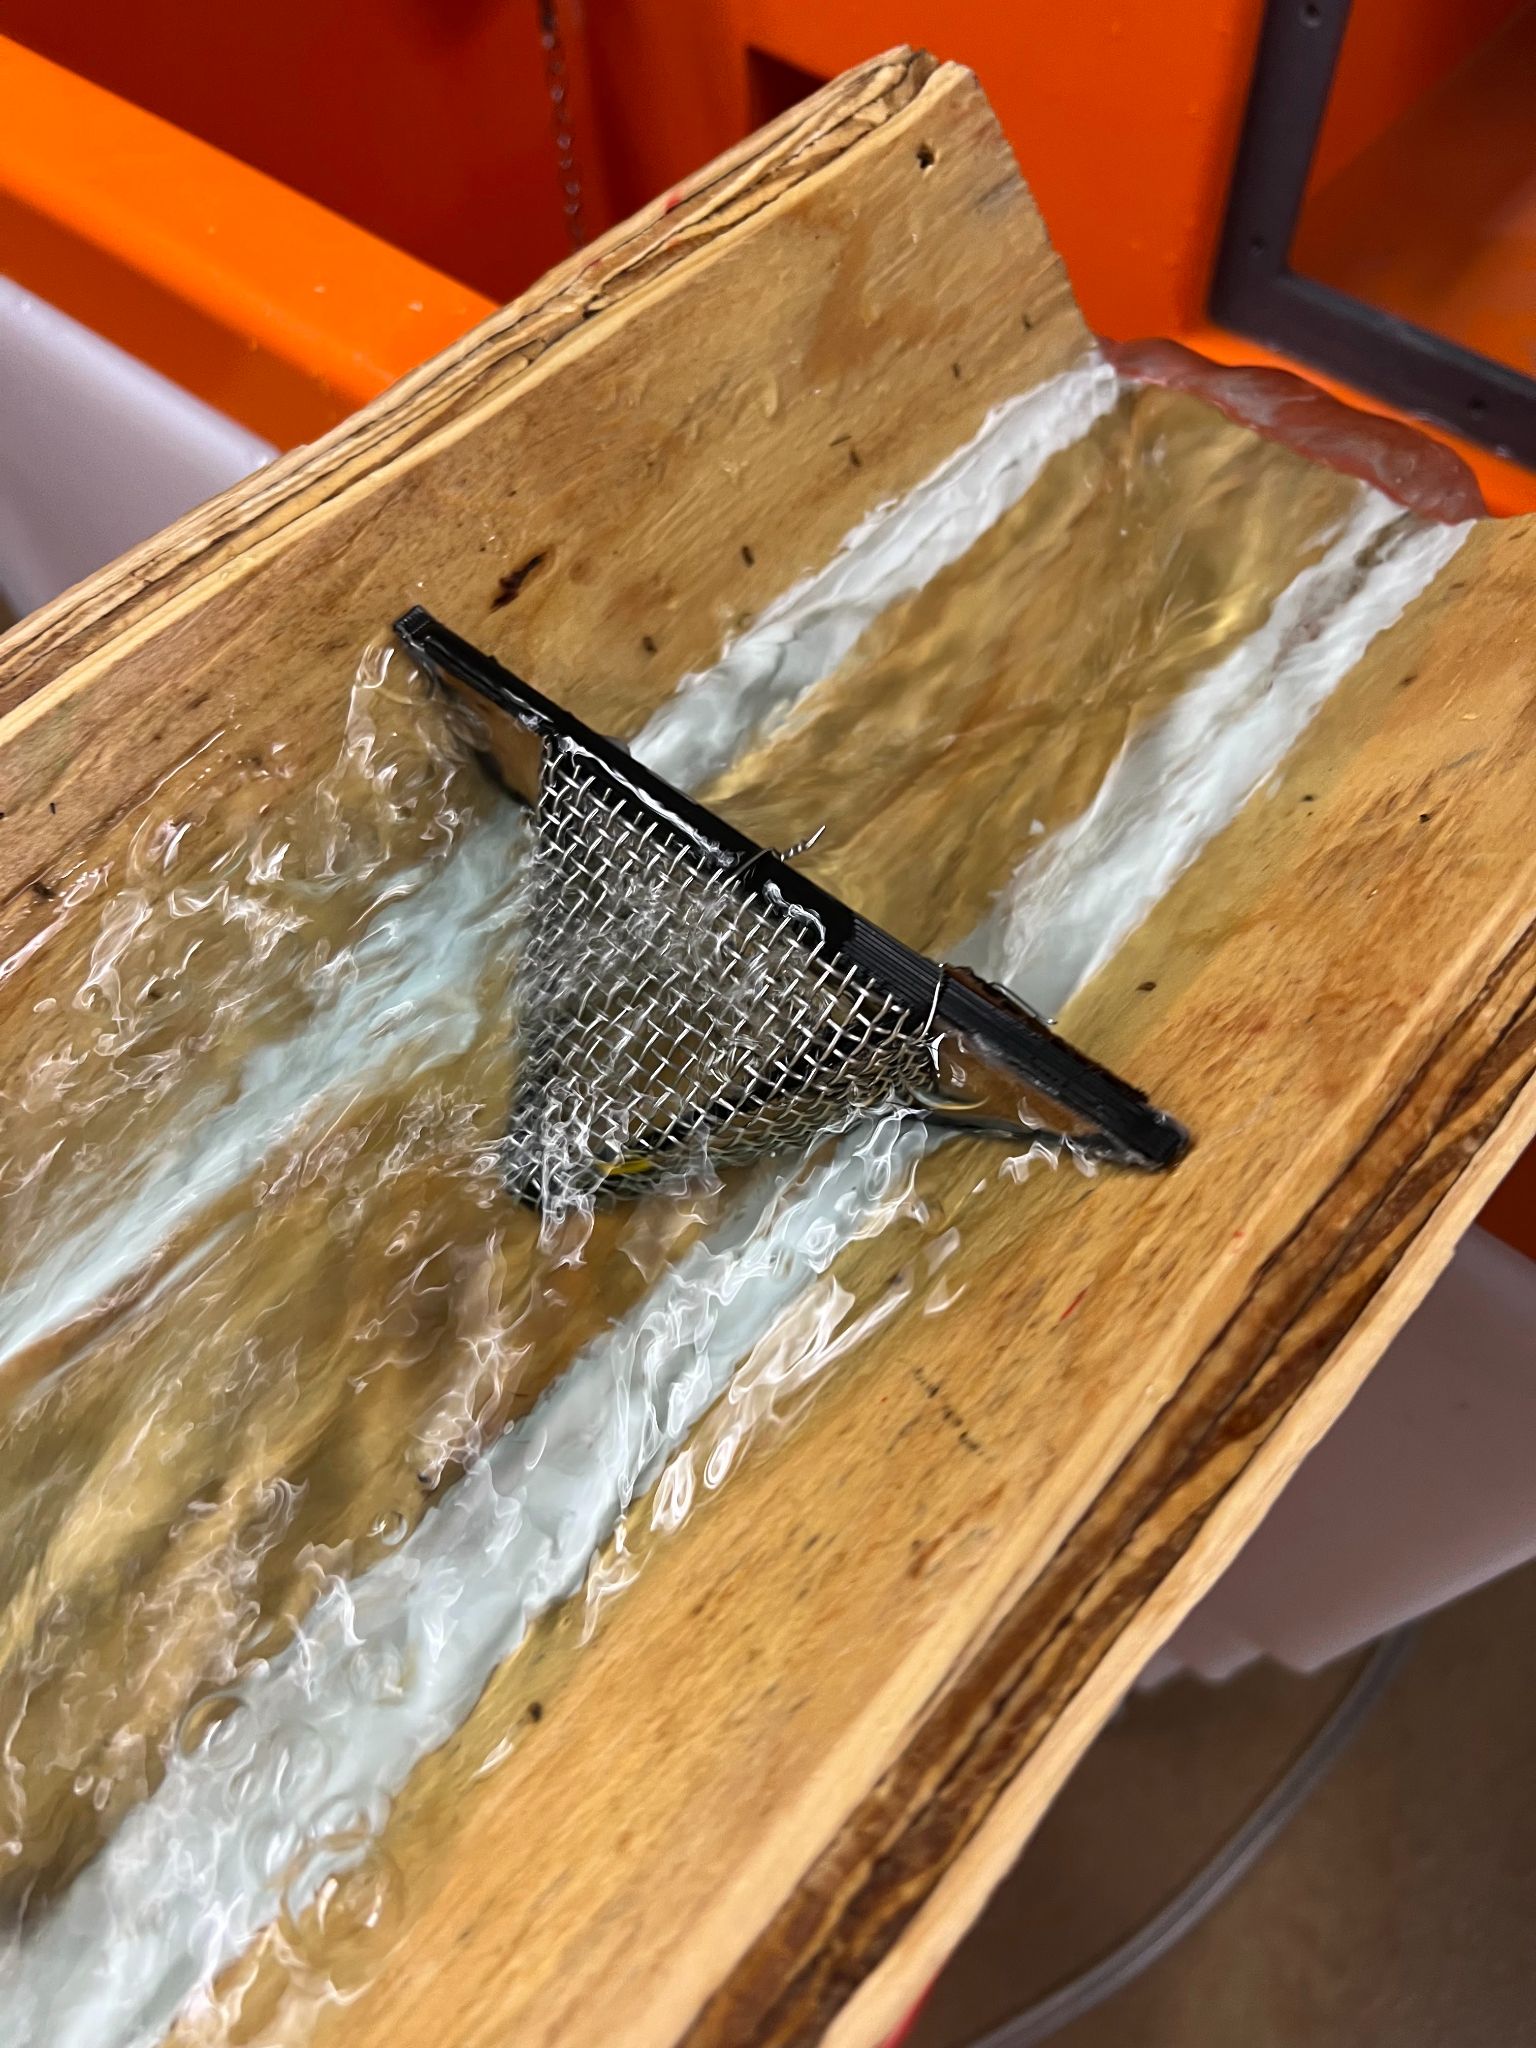
Measuring Flow Rate for Arrowhead Bar Frame with #8 Mesh at a 35° Angle
Photo by Samuel Turner
Experimental Values
To perform tests on each bar screen design, the following experimental values were recorded in an experimental matrix:
Depth of Water Without Bar Screen - Used to determine flow efficiency.
Bottom Width of Flume - Used to determine flow efficiency.
Flow Rate of Water in Flume - Used to determine flow efficiency.
Depth of Water With Bar Screen - Used to determine flow efficiency.
Weight of Pine Needles - Used to determine percentage of pine needles passing through versus sticking on bar screen.
Large Debris Gap - Visual observation used to determine if large debris was pushed up above water line, leaving room for pine needles to still pass through the screen.
Debris Being Pushed Over - Visual observation used to determine if large debris was pushed up and over the bar screen.
Testing Methods
The following steps were taken when testing each bar screen design combination:
Step 1. Measure flow rate, bottom width of channel, and depth of water without bar screen installed.
Step 2. Measure depth of water with bar screen installed.
Step 3. Pass broom bristles down flume and collect bristles that passed through the bar screen in a sieve.
Step 4. Weigh broom bristles that collected in the sieve.
Step 5. Weigh broom bristles that caught on the bar screen to determine total weight of pine needles passed down the flume.
Step 6. Calculate percentage of pine needles passed through the bar screen using both weights.
Step 7. Pass larger debris down flume and observe if it goes above the water line.
Step 8. Observe if the larger debris was pushed up and over the bar screen.

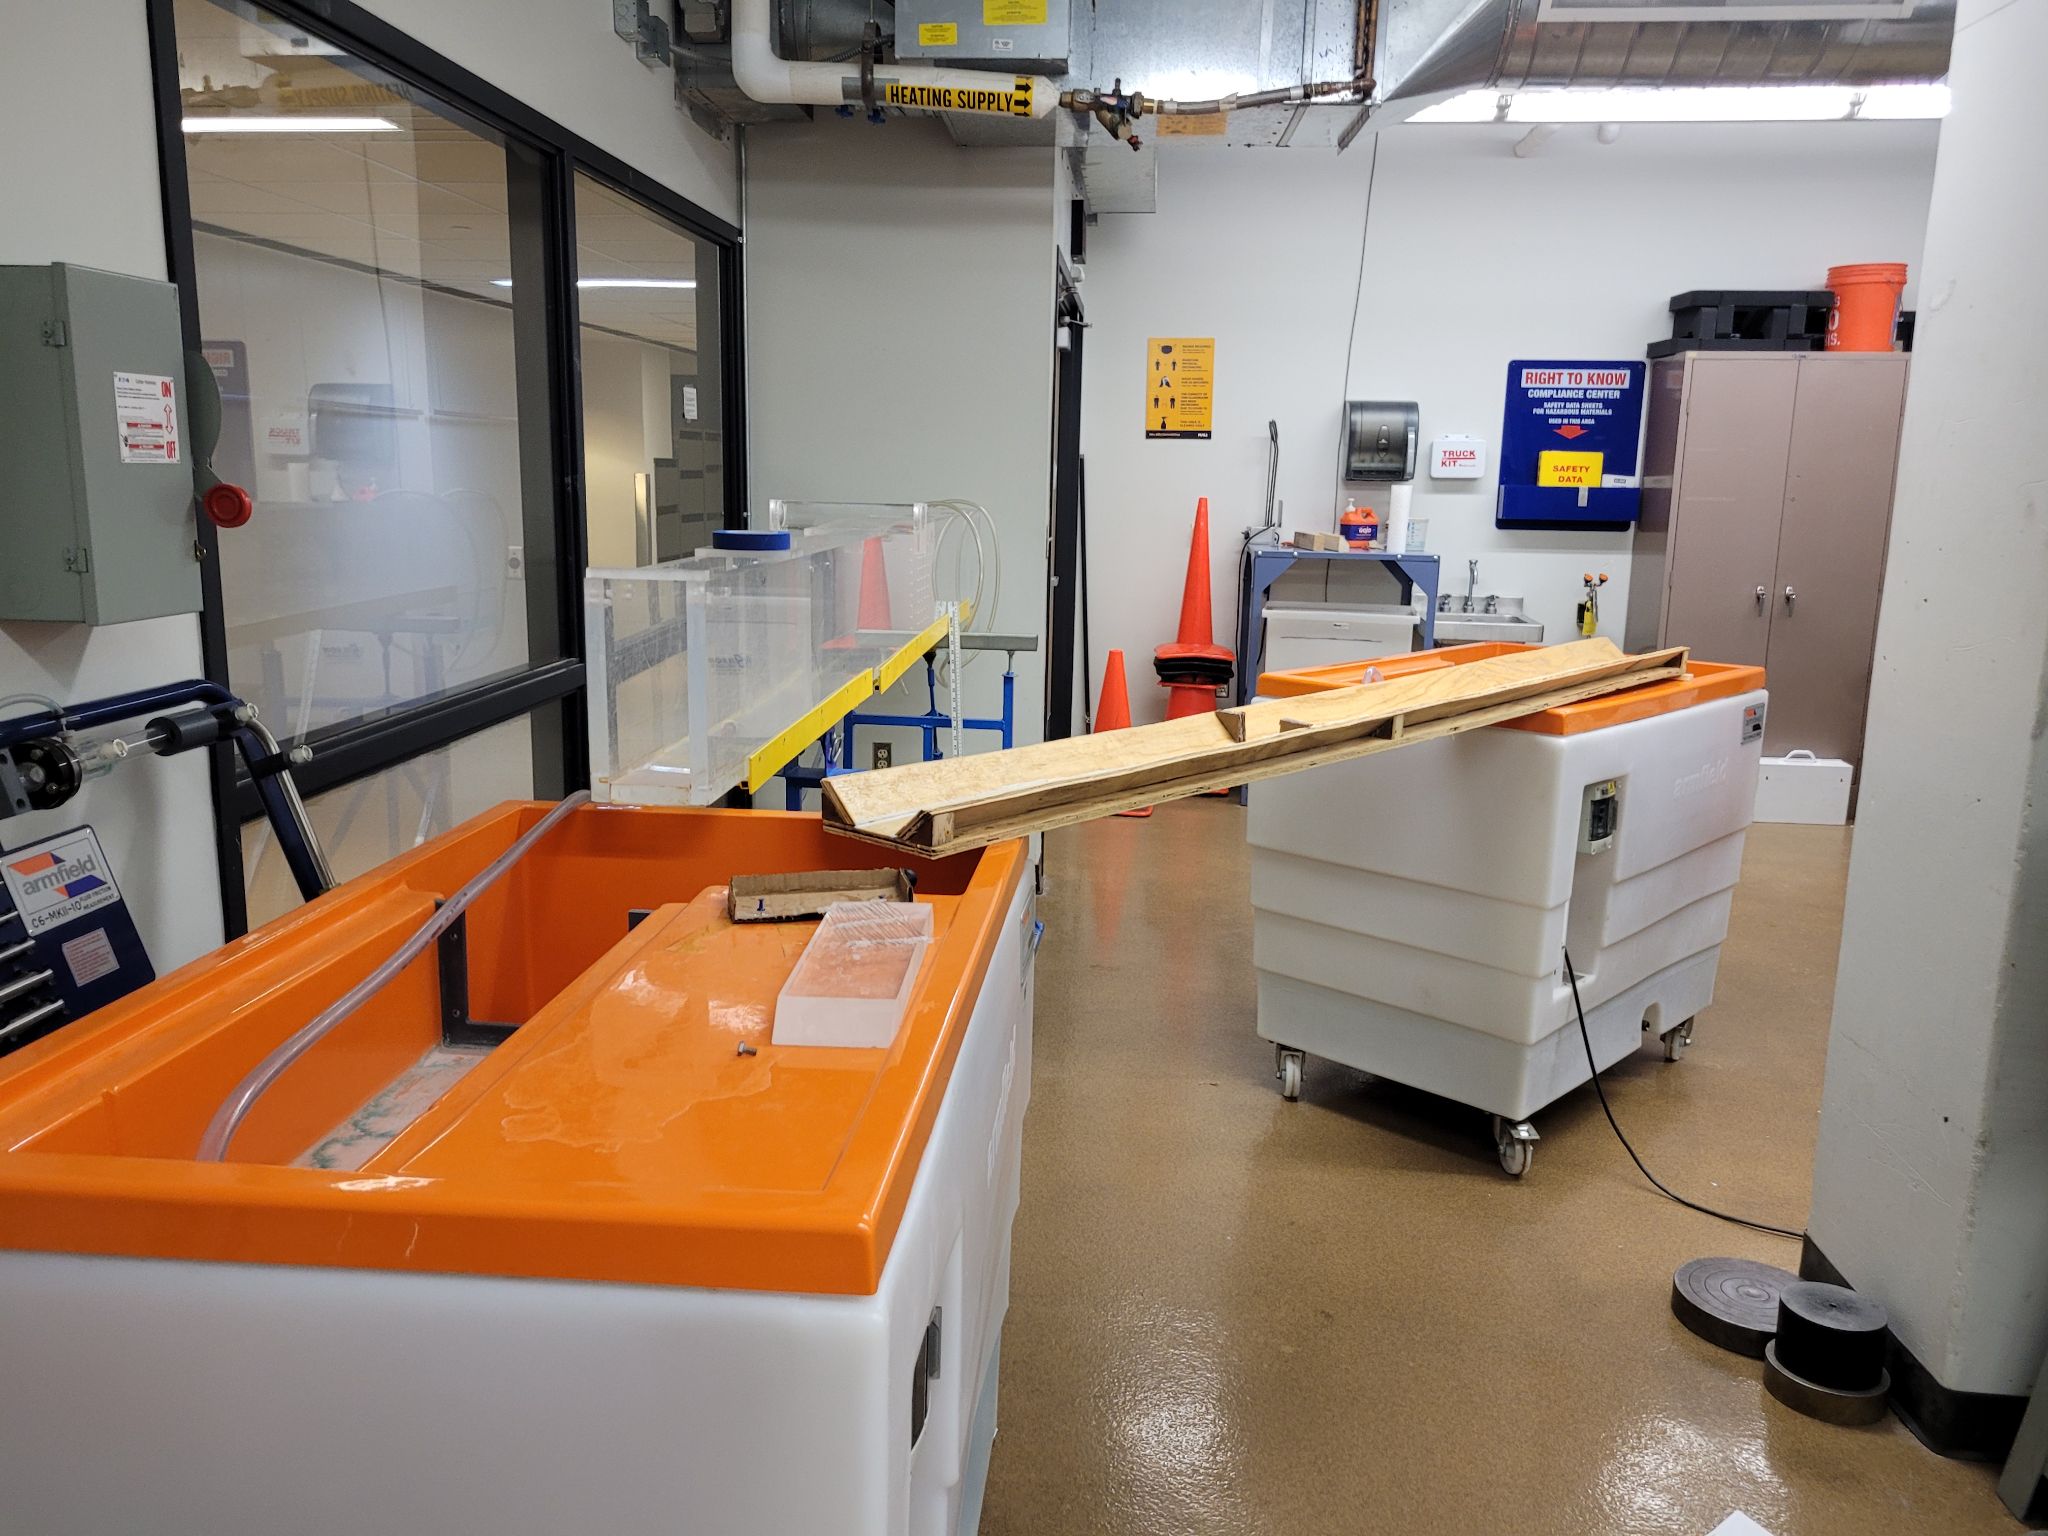
Flume Testing Setup
Photo by Diego Medina

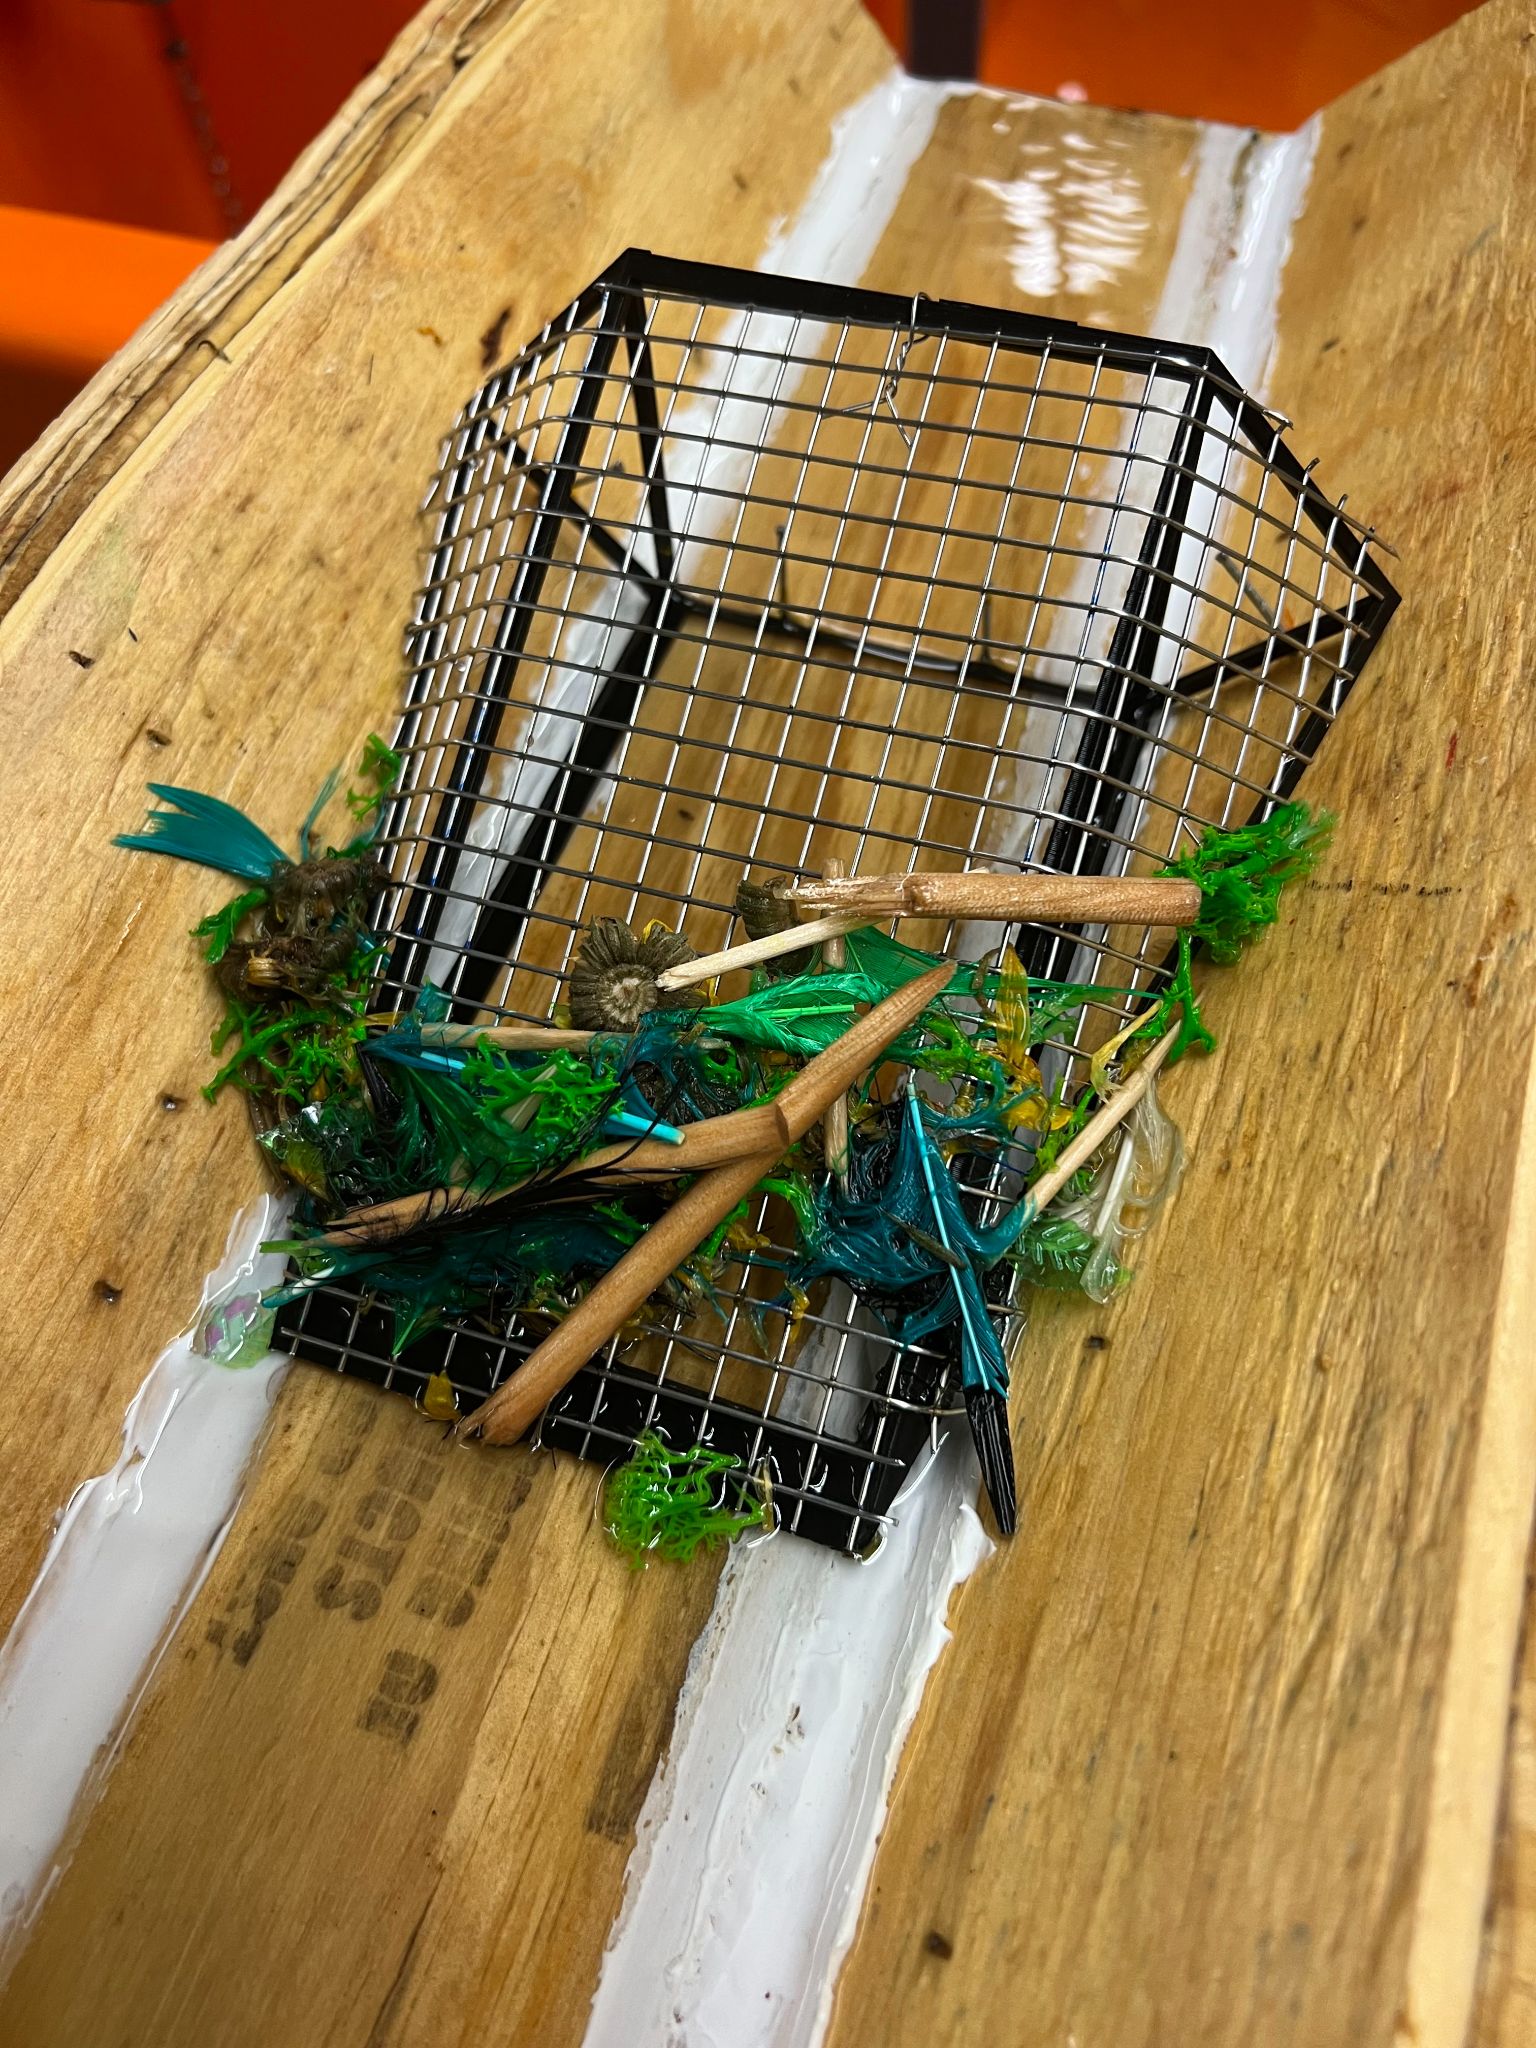
Large Debris Caught on Screen of Flatpoint Bar Frame with #8 Mesh at a 25° Angle
Photo by Samuel Turner

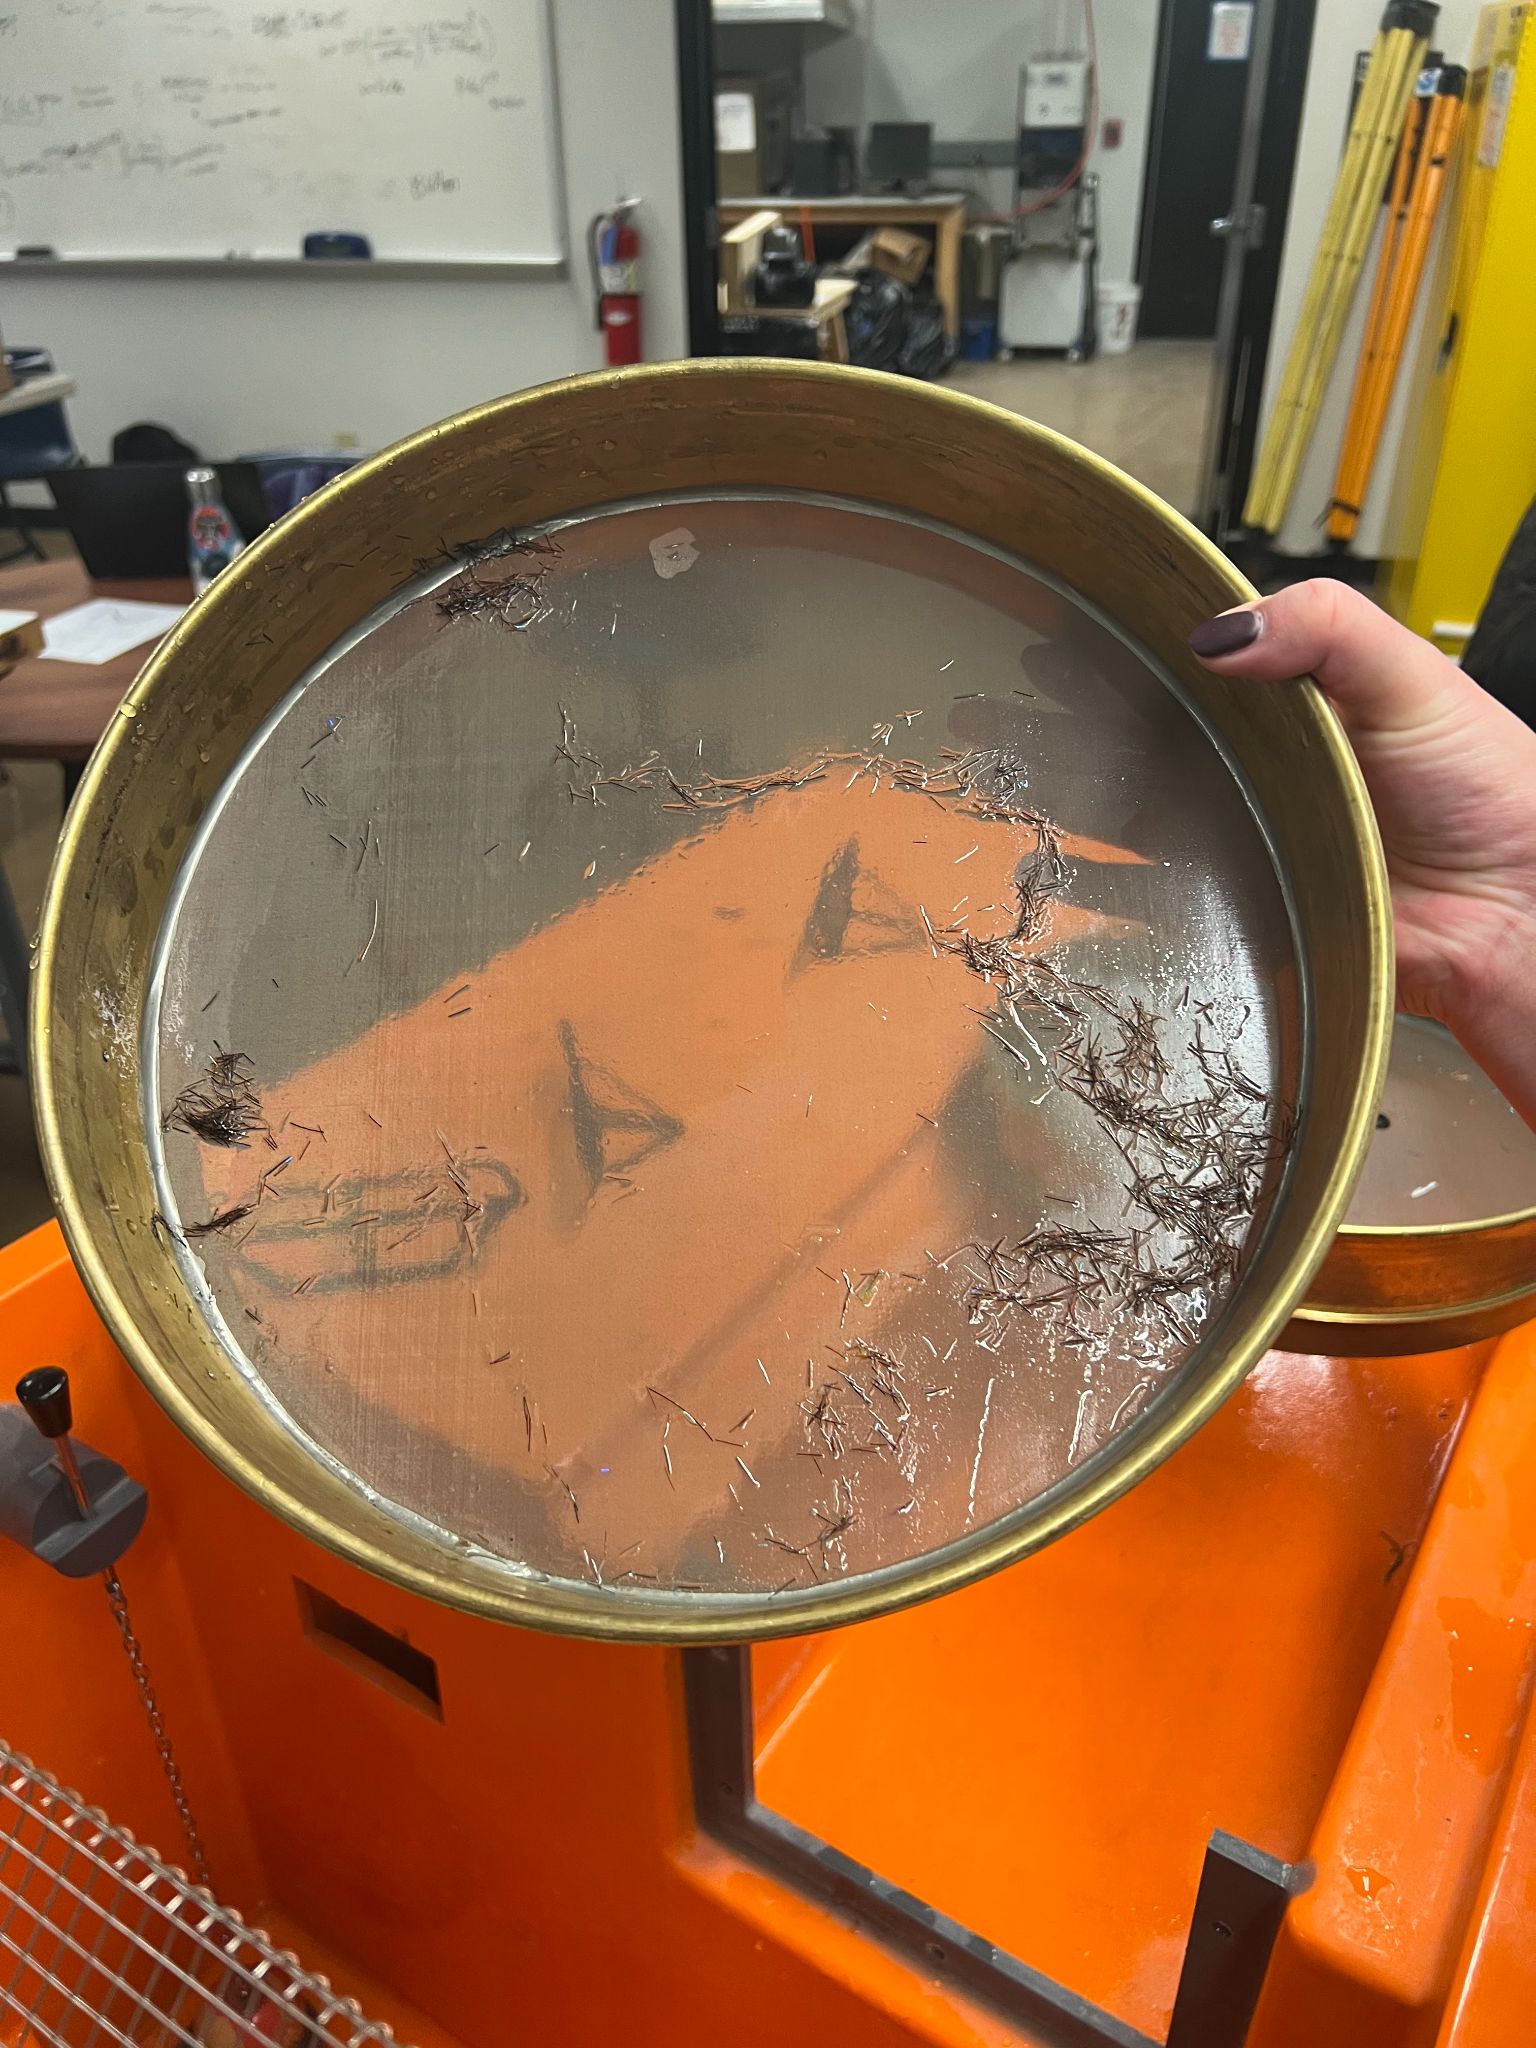
Broom Bristles that Passed through the Flatpoint Bar Frame with #8 Mesh at a 25 ° Angle
Photo by Samuel Turner
Results of Analysis
The results of the Experimental Matrix Data were applied to the Decision Matrix to achieve the following results:
Bar Frames

The average of the bar frame results from the Decision Matrix is shown on the left. The following observations were made during testing:
Arrowhead Frame caused severe flooding.
Curved and Flatpoint Frames performed well in most categories.
Flatscreen Frame mainted flow efficiency the best.
Bar Screen Angles
The average of the bar screen angle results from the Decision Matrix is shown on the right. The following observations were made during testing:
45° Angle maintained flow efficiency the best.
35° Angle showed mild success at all categories.
25° Angle prevented blockages the best.

Bar Screens

The average of the bar screens (mesh) results from the Decision Matrix is shown on the left. The following observations were made during testing:
#4 Mesh maintained flow efficiency and passed small debris through the best.
Each mesh struggled increasingly with maintaining flow efficiency and passing small debris through as they got smaller.
