Sample Analysis
X-Ray Fluorescence (XRF) analysis was used to test for heavy metal contamination in the soil samples. From the XRF results, Lead (Pb), arsenic (As), and antimony (Sb) were selected as the human health contaminants of concern (COCs). The XRF data for Pb, As, and Sb were log-normally distributed. Histograms of the log-transformed data are shown in Figures 1-3. These log transformations were necessary to calculate the 50% and 95% exposure point concentrations for each COC.
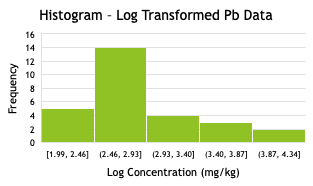
Figure 1: Histogram - Log transformed Lead Data
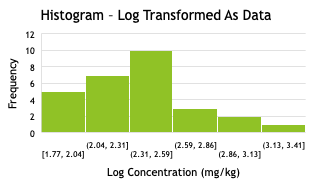
Figure 2: Histogram - Log transformed Arsenic Data
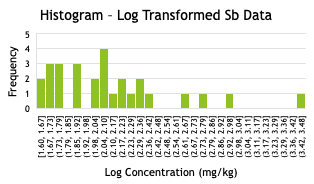
Figure 3: Histogram - Log transformed Antimony Data
Confirmatory Analysis for Arsenic
Because the arsenic and lead wavelengths read by the XRF partially overlap, there was a concern that the XRF arsenic concentrations may have skewed high when high concentrations of lead were present. To confirm the arsenic results from the XRF analysis, ten samples were chosen to be outsourced to Western Technologies to perform Inductively Coupled Plasma Emission Spectroscopy (ICP) analysis. The selected samples represent the range of arsenic concentrations found at the site, shown in Table 1. These samples were also chosen due to their low lead concentrations. A correlation curve was created using the XRF results and the ICP results, shown in Figure 4. All arsenic data was adjusted using the correlation.
Table 1: Arsenic Confirmatory ICP Analysis Results
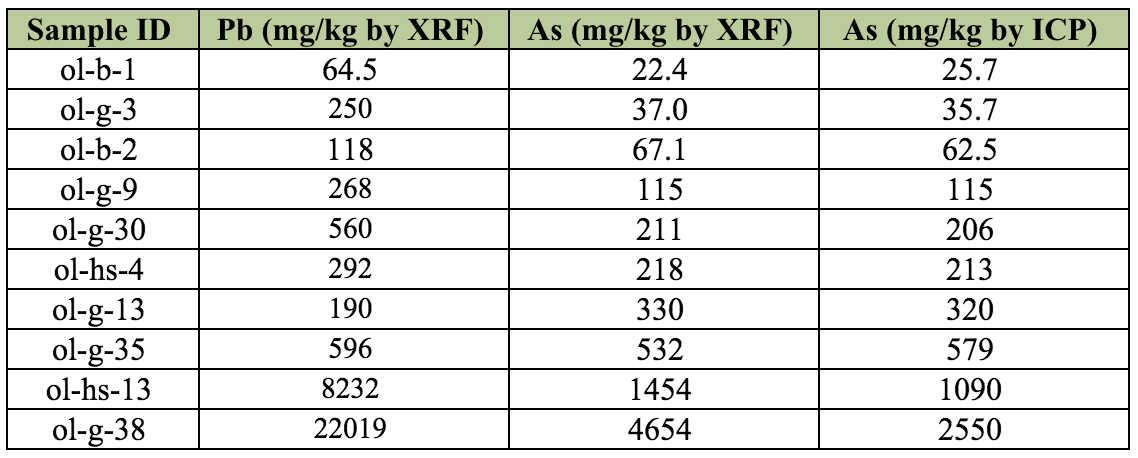
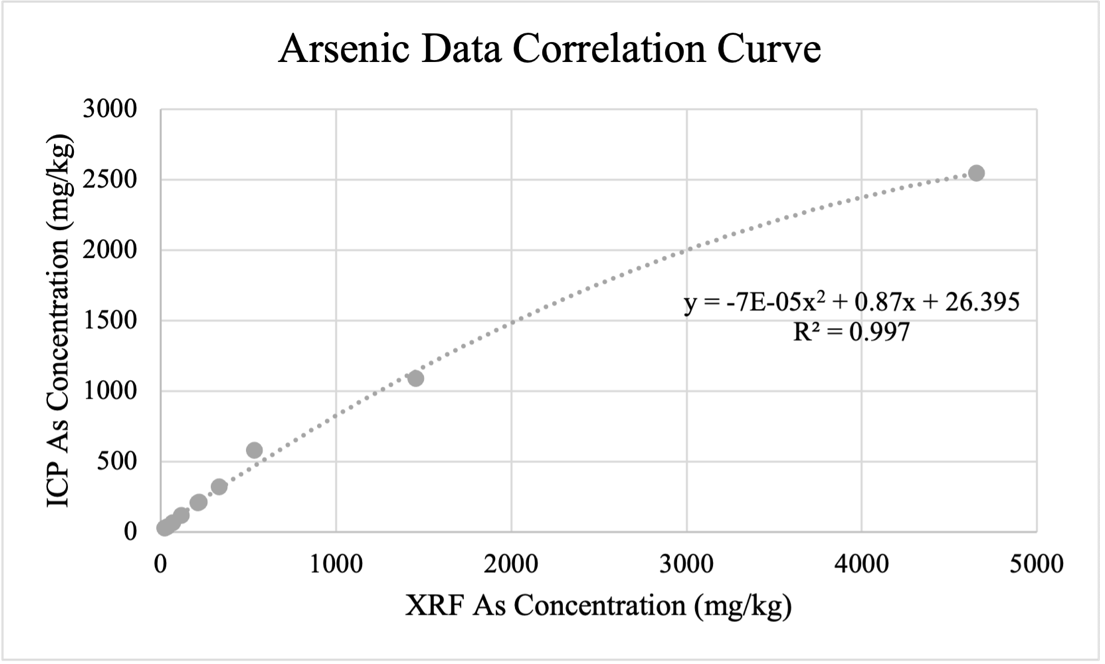
Figure 4: Arsenic ICP and XRF Correlation
Spatial Distribution Maps
Spatial distribution maps were created for all human health COCs (lead, arsenic, antimony). The maps identify samples that are below the residential Arizona Soil Remediation Standard (AZSRS), between the residential and non-residential standards, and exceeding the non-residential standard. All samples contained arsenic concentrations above the non-residential and residential AZSRS, which are both 10 mg/kg due to arsenic's carcinogenic effects. Therefore, the median concentration of the data set (200 mg/kg) was used to show more highly contaminated areas.
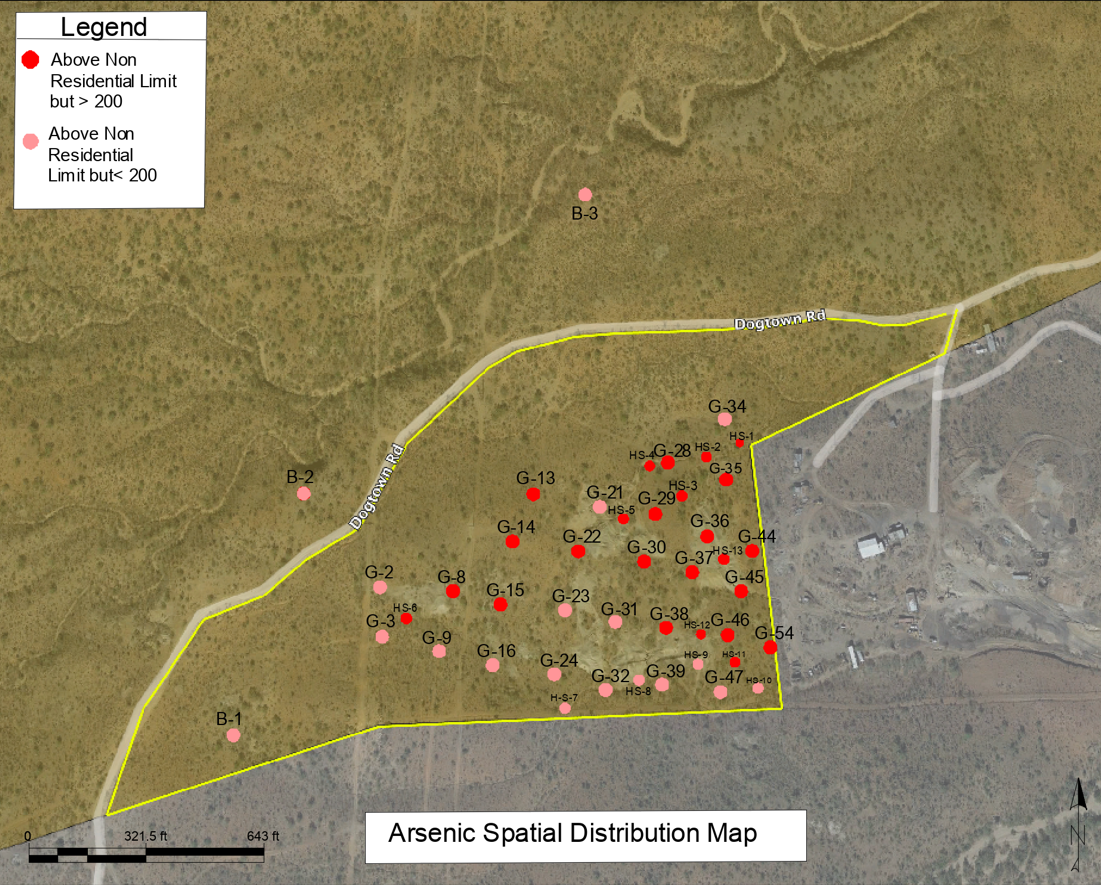
Figure 5: Arsenic Spatial Distribution Map
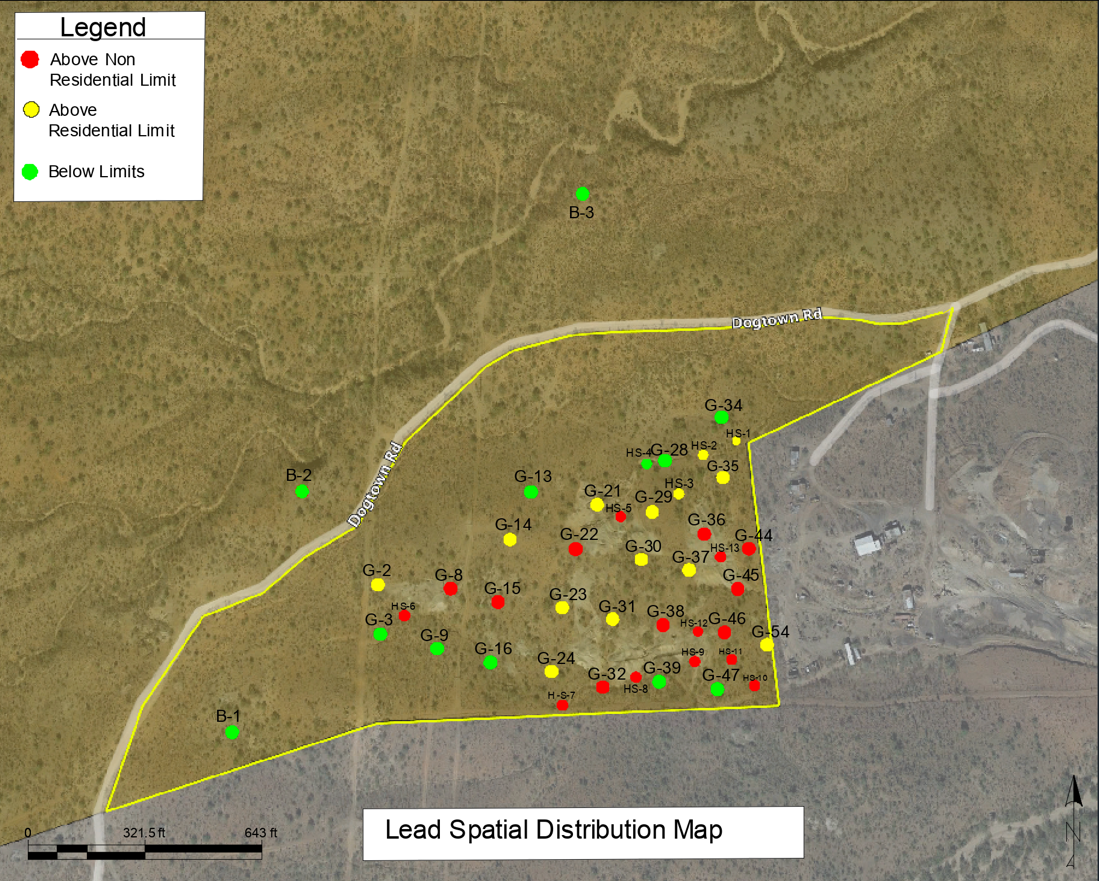
Figure 6: Lead Spatial Distribution Map
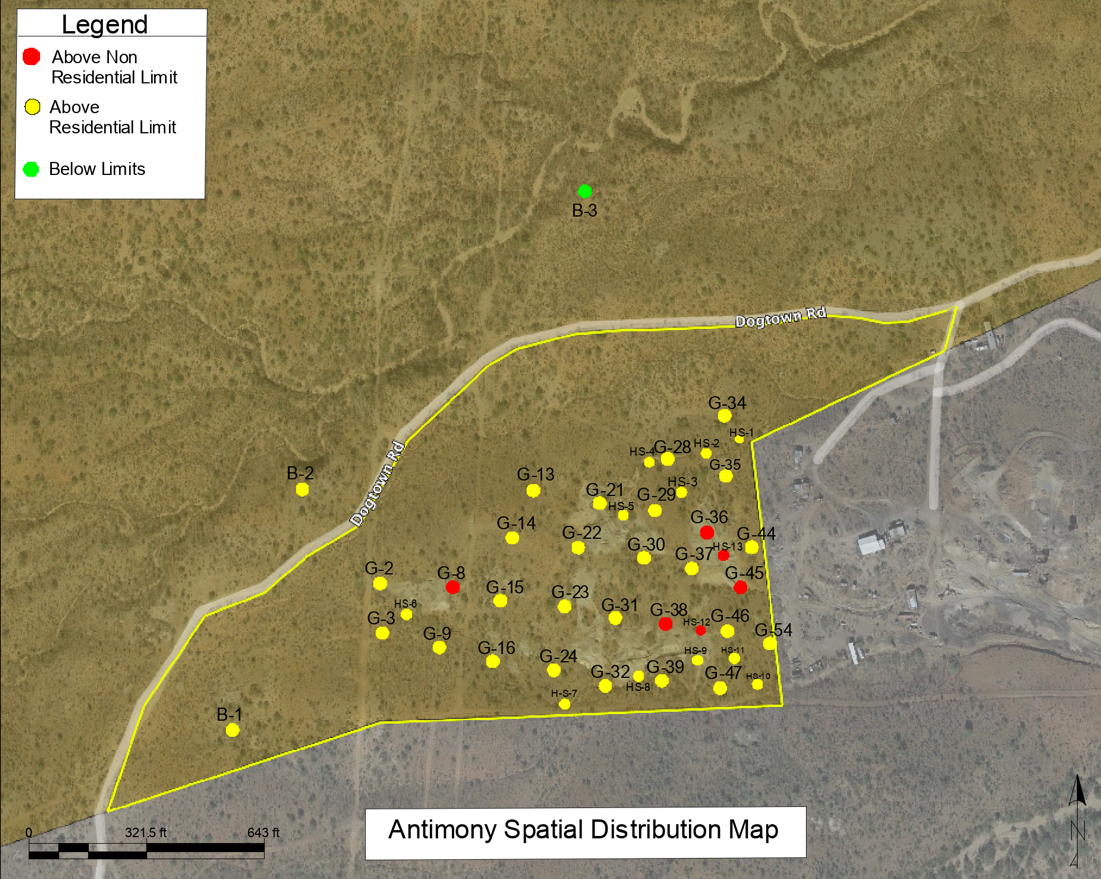
Figure 7: Antimony Spatial Distribution Map
