 |
Corn Cob Biosorbent Research |
 |
Project Findings
All findings from this research project can be found on this page; including data collected during lab testing for untreated and treated corn, column testing, column scale-up, and general project impacts.
Untreated Corn Adsorption Data
Cadmium testing for untreated corn was done using HACH Method 8017 (Cadmium Dithizone Method). In summary, cadmium concentrations are measured using colorimetric determination. Various chemicals and solvents are added to a contaminated water sample. If cadmium is present in the sample, a pink color forms within the solvent. Based on the strength of the pink color, the cadmium concentration can be correlated using internal calibration data from the DR 3900. Table 1 below shows the data collected directly from the DR 3900 spectrophotometer.
Method 8017 for untreated corn
|
**sample was prepared incorrectly and was therefore discarded
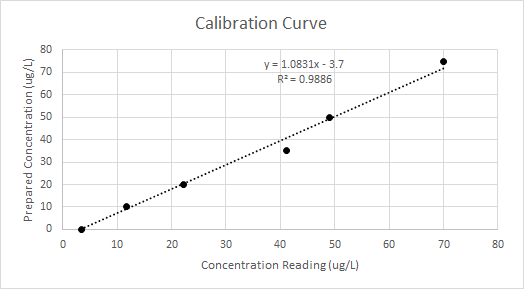
Before the data in Table 1 could be used to produce an isotherm, it needed to be calibrated. To calibrate cadmium data, all cadmium standards were tested using HACH Method 8017. In total, five standards plus a reagent blank were tested and concentrations were measured. To make a calibration curve, the concentration readings (ug/L) given by the DR 3900 spectrophotometer were plotted against the prepared concentrations (ug/L). Figure 1 below shows the calibration curve and its regression formula.

Figure 1 - calibration curve for untreated corn
Table 2 - calibrated adsorption data for untreated corn; initial concentrations
were calibrated using the regression formula shown in Figure 1
Trial |
Equilibrium Conc. A (ug/L) |
Equilibrium Conc. C (ug/L) |
Equilibrium Conc. B (ug/L) |
1 |
2.6 |
X* |
1.3 |
2 |
2.6 |
3.6 |
4.9 |
3 |
10.3 |
11.5 |
11.1 |
4 |
X** |
9.8 |
11.5 |
5 |
24.8 |
18.2 |
18.0 |
**sample was prepared incorrectly and was therefore discarded
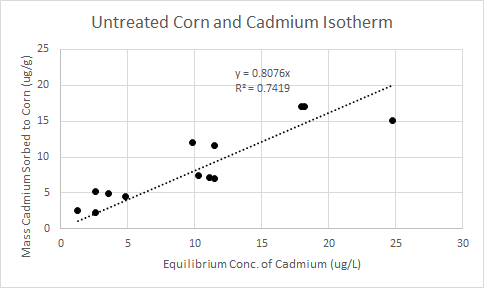
Using the calibrated data shown in Table 2, the mass of cadmium sorbed per gram of corn could be calculated. The change in concentration is calculated using the initial and final concentrations. Based on a sample volume of 300 mL for every test, the mass of cadmium removed is calculated (ug). Because all samples contained one gram of corn, the mass of cadmium removed is the isotherm's q value (ug/g). Below, Figure 2 shows the untreated corn and cadmium isotherm. The average removal efficiency for untreated corn was 76%.

Treated Corn Adsorption Data
Due to the problems encountered with HACH Method 8017 (explained in the final report located under Documents tab), treated-corn cadmium testing was sub-contracted to Western Technologies, Inc. in Flagstaff, AZ. Western Tech further sub-contracted the cadmium testing to Pace Analytical in Phoenix, AZ where cadmium testing was completed through Inductively Coupled Plasma Mass Spectrometry (ICP-MS). Adsorption testing for treated corn was done in duplicates rather than triplicates due to budget limitations. Table 3 below shows the data from ICP-MS testing. The data shown in Table 3 was not calibrated by the corn capstone team, as it was produced by a third-party lab.
Table 3 - treated corn adsorption data from ICP-MS testing
Prep'd Initial Conc (ug/L) |
Initial Conc. Reading (ug/L) |
Equilibrium Conc. A (ug/L) |
Equilibrium Conc. B (ug/L) |
10 |
8.47 |
ND |
ND |
20 |
25.6 |
ND |
1.05 |
35 |
35.4 |
1.28 |
1.35 |
50 |
48.4 |
1.43 |
1.92 |
75 |
70.6 |
2.2 |
2.11 |
"ND"=Not Detected (below 1 ug/L)
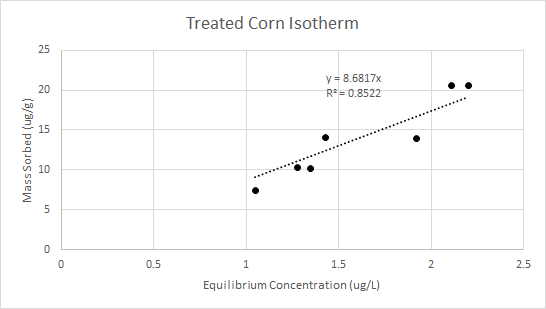
For the samples listed as ND in Table 3, the difference in concentration could not be determined with confidence. Therefore those samples were not used to produce the isotherm for treated corn. Figure 3 below shows the isotherm for treated corn and cadmium. The overall removal efficiency was 97%.

Figure 3 - treated corn and cadmium isotherm
Comparing the two isotherms for untreated and treated corn, it can be seen that the slope for the treated corn isotherm is much steeper (0.6589 vs 8.6817). This indicates that the treated corn has a much higher removal efficiency than untreated corn. Because the removal efficiency for treated corn was much higher than untreated corn, the mass of treated corn needed to treat a contaminated water source would be much less. Therefore, treated corn was selected for column testing.
Column Testing
To begin designing a column test to verify the capacity of the corn biosorbent, several parameters were first selected. First, our team specified that the influent cadmium concentration would be set at 75 ug/L. This value was chosen because it is within the range of typical values measured during mine spills where cadmium is present. In addition, this value was also tested during the isotherm prouction. Next, the target effluent concentration was set at 5 ug/L because this is the EPA's Maximum Contaminant Level (MCL) for cadmium. In summary, the MCL is the value that the EPA agrees that there should be no adverse health effects if consumed. Based on a change in concentration of 70 ug/L, the mass of corn per liter needed to treat a contamination can be calculated using the isotherms shown in Figures 2 and 3. Based on the isotherms for untreated and treated corn and the parameters outlined above, Tables 4 and 5 below show the mass of corn needed to treat a contamination.
Table 4 - Untreated Corn Calculations
*calculated from the isotherm |
Table 5 - Treated Corn Calculations
*calculated from the isotherm |
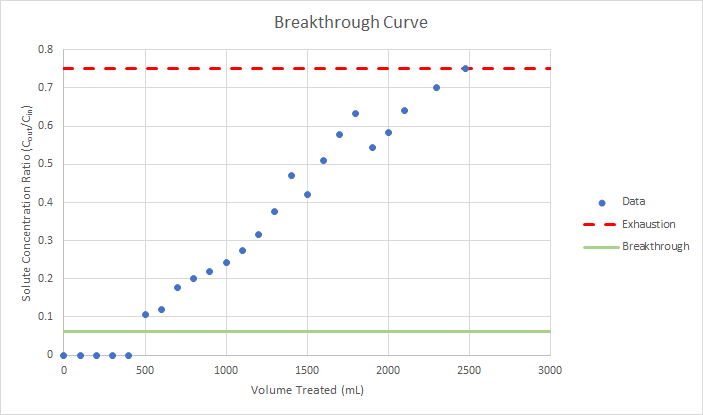
Based on the calculations shown in Tables 4 and 5, the treated corn has nearly eleven times the capacity to treat a cadmium spill compared to the untreated corn. Because of this advantage, treated corn was used for the column test. Our team had 2.5 grams of treated corn remaining after our lab testing. Therefore, it was expected that our treated corn would be able to treat about 1,500 mL of contaminated cadmium water using the influent and effluent concentrations shown in Tables 4 and 5. Because our team could not perform real-time analysis on the column's effluent, our team devised a sampling plan that instructed how many samples would be taken and when. After completing the column test and receiving the data from Western Tech., the following breakthrough curve was produced (Figure 4).

It was intended that the initial concentration to the column would be 75 ug/L; however, the standard prepared was measured at 82.2 ug/L. Additionally, it was assumed that the column's effluent would measure 5 ug/L; however, the effluent initially tested to be below the limits of detection for ICP-MS, or 1 ug/L. Based on the breakthrough curve, the column was able to treat 457 mL before breakthrough occured. Rather than showing the measured concentration on the y-axis, the breakthrough curve shows the effluent to influent concentration ratio; every concentration value was divided by 82.2 ug/L, and our corn was considered to be exhausted at a ratio of 75%.
Column Scale-Up
The breakthrough data was used to design a full-size column to be used in a water treatment process following the Bohart-Adams model. A flow rate of 50,000 gallons per day was selected as this flow rate is within the typical range for rural communities. Table 6 shows the finalized column parameters for a scaled up water treatment process. In total, three columns will be run in series because this prolongs the life of the corn biosorbent as well as provides an easy way to replace any single column after the corn is exhausted. To follow these calculations using the Bohart-Adams model, click here to download the excel sheet.
Final Design Results |
||
| n | 3 | columns |
| Loading Rate | 1.2 | m/hr |
| Area | 7 | m2 |
| Diameter | 3 | m |
| Bed Height | 4 | m |
| Bed Volume | 27 | m3 |
| Bead Height | 2 | m |
| Total Vessel Volume | 41 | m3 |
| Cob Utilization Rate | 216 | kg/day |
| Change Out Period | 30 | days |
| Mass of Corn Required | 6473 | kg |
Project Impacts
The environmental, economic, and social impacts were qualitatively considered for this research project. Environmentally, the research for corn biosorbents provides an alternative to clean up cadmium contaminated drinking water, allowing for cleaner ecosystems and healthier wildlife. Additionally, by using corn cobs as a material to treat drinking water, corn cob waste could be diverted from ending up in landfills. However, because there lacks research on the regeneration of a corn cob biosorbent, any cadmium-exhausted corn would ultimately have to be placed into a hazardous waste landfill.
Economically, corn biosorbents could provide cheaper methods to purifying cadmium contaminated drinking water. While treated corn showed the highest cadmium removals, the most economic option to treat a contaminated water source would be using untreated corn. This is because the cost of using nitric acid and sodium hydroxide accounted for 98.9% of the unit cost for treated corn. After analyzing unit costs, untreated corn costed $0.22/kg, while treated corn costed $15.42/kg. Additionally, corn biosorbent production would help provide an additional source of income for corn-growing farmers located in parts of the country near mine sites.
Socially, corn biosorbents could allow for rural communities to take pride in the fact that their locally grown corn was implemented to provide clean drinking water. Additionally, corn biosorbents could provide the means to improve the health of residents living near contaminated water. However, there are some people in the United States that have a corn allergy. While it is rather rare, symptoms can range from mild itching to anaphylaxis. Therefore, there would need to be research to quantify the amount of residual corn solids from a treatment process to ensure the health and safety of those with a corn allergy.