Corn Cob Biosorbent Research |
General information about this research project can be found here. Included on this page are the background to how this research began, the project tasks that were completed for this capstone project, the scheduling of the different tasks, the staffing plans to complete the tasks, and the project budget.
Melissa Jacquez began researching the potential for corn cobs to remove cadmium from drinking water in Fall 2017 and Spring 2018. She received funding as an intern under the NASA Space Grant Program, where she conducted cadmium testing and produced a preliminary isotherm (background research photos). While the preliminary results looked promising, there was insufficient amount of concentrations and inconclusive data. To continue this research, Melissa's project was created into a capstone project.
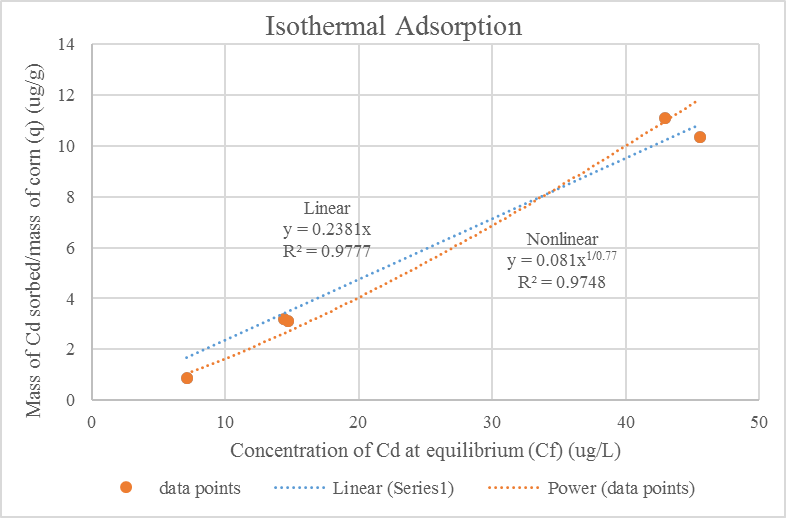
Figure - preliminary isotherm produced from Melissa's initial research
Here is a list of the major tasks for our project. To see the subtasks within each major task, see the project schedule or staffing plan below.
|
Our project schedule and Gantt charts can be found here. Some tasks are dependent on the previous task being completed, while others can be started simultaneously. Our team developed a schedule during the proposal phase, and adjustments were made during the course of the project. In total, the project is going to last 197 days. Below, the original and updated Gantt chart can be found.
Figure (above) - Old Gantt chart (critical path is highlighted)
After experiencing set-backs during the course of the project, some tasks were eliminated. The first major set-back was the breaking of the team's only separatory funnel. Our team expected to wait only one week for a new one to ship and arrive at NAU's environmental lab; however, we ended up waiting three weeks. The next major set-back was disocvering that the cuvette samples that are analyzed for cadmium concentrations were light-sensitive and the absorbance (correlated to the concentration) decreased over time. Our team needed to account for this because it gave us far greater removal efficiencies. Finally, our team discovered that our original prediction for the time needed to complete lab testing was very inaccurate. We expected to spend 3 hours to complete any given concentration during our testing (3 replicates for each). We discovered it took twice as long, or 6 hours on any given lab day. Due to these reasons, our team eliminated lead testing from our project. Below, shows the updated Gantt chart for the project schedule.
Figure (above) - updated Gantt chart (critical path shown in red)
Our project consists of three different roles; a senior engineer, a project engineer, and a lab technician. Below, is the proposed staffing plan that our team initially expected to spend on this project. In total, 625 hours were estimated to complete this project.
Table 1 - Proposed staffing plan
Task |
SENG Hours |
ENG Hours |
LAB Hours |
Total |
Task 1.0 Experimental Methods |
0 |
0 |
190 |
190 |
Task 1.1 Corn Biosorbent Preparation |
|
|
36 |
36 |
Task 1.2 Cadmium Testing |
|
|
71 |
71 |
Task 1.3 Lead Testing |
|
|
83 |
83 |
Task 2.0 Isotherm Development |
1 |
11 |
0 |
12 |
Task 3.0 Prototype Design |
8 |
14 |
0 |
22 |
Task 3.1 Design Calculations |
1 |
9 |
|
10 |
Task 3.2 Construction Drawings |
1 |
5 |
|
6 |
Task 3.3 Construction |
6 |
|
|
6 |
Task 4.0 Pilot Testing and Scale-up |
2 |
12 |
109 |
123 |
Task 5.0 Cost Benefit Analysis |
1 |
11 |
0 |
12 |
Task 5.1 Feasibility Assessment |
0.5 |
5.5 |
|
6 |
Task 5.2 Assessment of Benefits |
0.5 |
5.5 |
|
6 |
Task 6.0 – Project Management |
113 |
153 |
0 |
266 |
Task 6.1 Professional/Team Interactions |
108 |
|
|
108 |
Task 6.2 Project Deliverables |
|
79 |
|
79 |
Task 6.2.1 30% Report |
|
16 |
|
16 |
Task 6.2.2 60% Report |
|
20 |
|
20 |
Task 6.2.3 Final Report |
5 |
10 |
|
15 |
Task 6.2.4 Website |
|
20 |
|
20 |
Task 6.2.5 Final Presentation |
|
8 |
|
8 |
TOTAL |
125 |
201 |
299 |
625 |
Due to unexpected complications during lab testing, more hours needed to be spent to ensure the best quality of data possible. Below, is the finalized staffing plan for this research project.
Table 2 - actual staffing plan
Task |
SENG Hours |
ENG Hours |
LAB Hours |
Task total |
Task 1.0 Experimental Methods |
0 |
18 |
308.5 |
326.5 |
Task 1.1 Corn Biosorbent Preparation |
0 |
10 |
103 |
113 |
Task 1.2 Cadmium Testing |
0 |
8 |
205.5 |
213.5 |
Task 2.0 Isotherm Development |
0 |
7 |
0 |
7 |
Task 3.0 Prototype Design |
0.5 |
72.5 |
8 |
81 |
Task 4.0 Pilot Testing and Scale-up |
0 |
34.5 |
11.5 |
39 |
Task 5.0 Cost Benefit Analysis |
2 |
21.5 |
0 |
23.5 |
Task 5.1 Feasibility Assessment |
0 |
13.5 |
0 |
13.5 |
Task 5.2 Assessment of Benefits |
2 |
8 |
0 |
10 |
Task 6.0 Project Management |
153 |
147 |
0 |
325 |
Task 6.1 Professional/Team Interactions |
91 |
32.5 |
0 |
128 |
Task 6.2 Project Deliverables |
62 |
114.5 |
0 |
197 |
Task 6.2.1 30% |
30.5 |
2.5 |
0 |
33 |
Task 6.2.2 60% |
23.5 |
9 |
0 |
32.5 |
Task 6.2.3 Final Report |
1.5 |
39.5 |
0 |
41 |
Task 6.2.4 Website |
0 |
36 |
0 |
36 |
Task 6.2.5 Presentation |
6.5 |
27.5 |
0 |
54.5 |
TOTAL |
180.5 |
300 |
328 |
809 |
Based off the staffing plans shown above, the proposed budget and the actual budget are shown below.
Table 3 - proposed budget
Personnel |
|||
Classification |
Hours |
Rate, $/hr |
Cost |
SENG |
125 |
120 |
$15,000 |
ENG |
201 |
90 |
$18,090 |
LAB |
299 |
55 |
$16,445 |
Total |
$49,535 |
||
Supplies |
|||
Item |
Quantity |
Cost Each |
Cost Total |
Syringe Pump |
1 |
300 |
$300 |
Cadmium Reagents |
56 |
6.80 |
$381 |
Lead Reagents |
63 |
7.52 |
$474 |
Acrylic Plexiglass (2'x6') |
1 |
14 |
$14 |
Corn Cobs |
60 |
1 |
$60 |
Ninja Food Processor |
1 |
20 |
$20 |
PPE |
4 |
90 |
$360 |
Lab Rental Fee |
45 days |
286/day |
$12,870 |
Total |
$14,479 |
||
Subcontracting |
|||
Subcontractor |
Cost |
||
Engineering Fabrication Shop |
$50.00 |
||
Total |
$50.00 |
||
Project Total |
|||
$64,064 |
Table 4 - actual budget; $17,537 over
Personnel |
|||
Classification |
Hours |
Rate, $/hr |
Cost |
SENG |
180.5 |
120 |
$21,660 |
ENG |
300.5 |
90 |
$27,045 |
LAB |
328 |
55 |
$18,040 |
Total |
$66,745 |
||
Supplies |
|||
Item |
Quantity |
Cost Each |
Cost Total |
Peristaltic Pump |
1 |
1,720 |
$1,720 |
Cadmium Reagents |
36 |
6.8 |
$245 |
Adsorption column |
1 |
46.4 |
$46 |
Corn Cobs |
60 |
1 |
$60 |
Ninja Food Processor |
2 |
20 |
$40 |
PPE |
4 |
90 |
$360 |
Lab Rental Fee |
41 |
286/day |
$11,726 |
Total |
$14,197 |
||
Subcontracting |
|||
Subcontractor |
Cost |
||
Western Technologies Inc. |
$659 |
||
Total |
$659 |
||
Project Total |
|||
$ 81,601 |