

NAU Traffic Signal Alternatives

Traffic Counts
Traffic Analysis

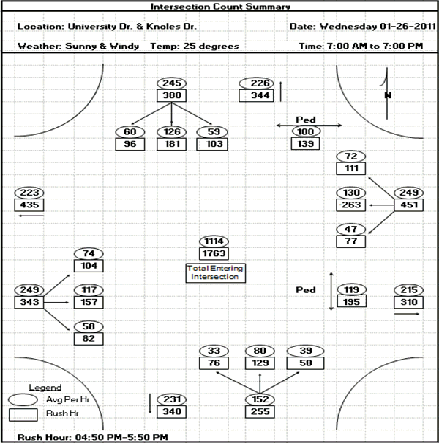
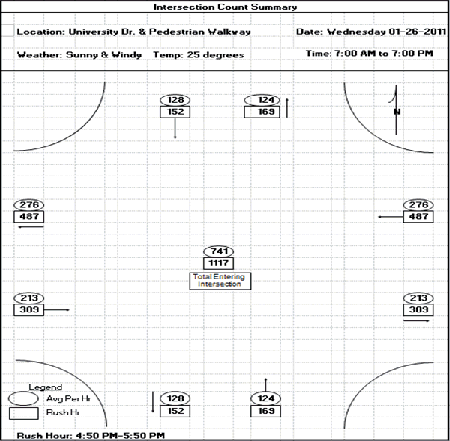
Traffic counts were performed on Wednesday January 23rd, 2011. These counts were
conducted from 7 am to 7 pm using two JAMAR boards. The traffic flows evaluated
include passenger cars, heavy vehicles, bikes, and pedestrians. The reason for a
twelve hour count was to ensure all possible peak hours would be accounted for as well
as a better understanding of the traffic types and flows during non-peak hours. All
counts have been entered into Excel and processed through HCM worksheets, HiCAP,
and Synchro.
Prior data counts and types have been acquired from David Hook (client) regarding
traffic counts that were performed for vehicles, bicycles, and pedestrians on October
29th, 2008 for NAU. These counts for the University Drive Corridor were taken and
used in comparison with the current counts. A summary of the characteristics of these
counts is shown below in Table 5.1.
The peak hour for this intersection was 0.84 for the times that were counted on
Wednesday January 23rd, 2011. This value represents a small change in vehicle and
pedestrian volumes during a course of an hour. A value of 1 would signify that all the
traffic passing through the corridor would enter the intersection during one 15 minute
interval within the hour, while a value of 0.25 would mean that the same amount of
traffic entered the intersection in every 15 minute interval of the hour. The values of
Peak Hour Volume Vehicle and Peak Hour Volume Pedestrians describe the highest
volume of respective traffic for a one hour interval in the 12 hour study. A total number
of 22,214 pedestrian and vehicles past through the corridor during the count study that
was performed.
The counts obtained in 2011 were analyzed via HCM data timing sheets, which gave a LOS of “B”. This level of service seemed too high for
the progression that was observed by IDD Engineering and the value verified using HiCAP. HiCAP returned the same LOS of “B” and the
timing plan was then taken directly into Synchro for a third verification. Synchro produced a LOS of “B” as well for the current timing plan.
This timing plan uses the minimum times, which based upon software packages, is the optimum timings for current conditions. The HiCAP
software was then utilized to estimate level of service for several alternative timing plans. These estimates were used in analyzing the three
possible alternatives which consist of; leave the design as is, cycle intersection simultaneously, and delayed or progression timing. Below
are the Synchro Summary sheets for the counts performed for this project.

Synchro Summary Sheets

|


Copyright Northern Arizona University, IDD Engineering
Last Modified: 4/28/11