What Are We Working On?
Challenges
Siting Challenge
One of the main challenges in the HCC is the siting challenge. In order to complete this challenge, our team has been look at thousands of sites in the United States. Using ArcGIS, the ME team is currently narrowing down thousands of sites to hundreds of sites. Our team will be looking at how close transmission lines are to the site in order to keep costs down. One of the more favorable type of sites we have been looking at is a decommissioned coal plant since it will already have nearby transmission lines and large basins for our reservoirs.
Community Connections
Our team has been working with the Energy Club on campus to complete our Community Connections Challenge. This challenge involves connecting with younger communities as well as the hydropower industry. To connect with younger groups, we have been discussing attending Science Saturdays held by Willow Bend, a local elementary school. We are also planning on building a renewable energy demonstration to showcase on campus. To connect with the industry, we are planning on holding a seminar with Energy Club to have professionals talk about renewable energies.
Design
Pumped Storage Hydropower Design

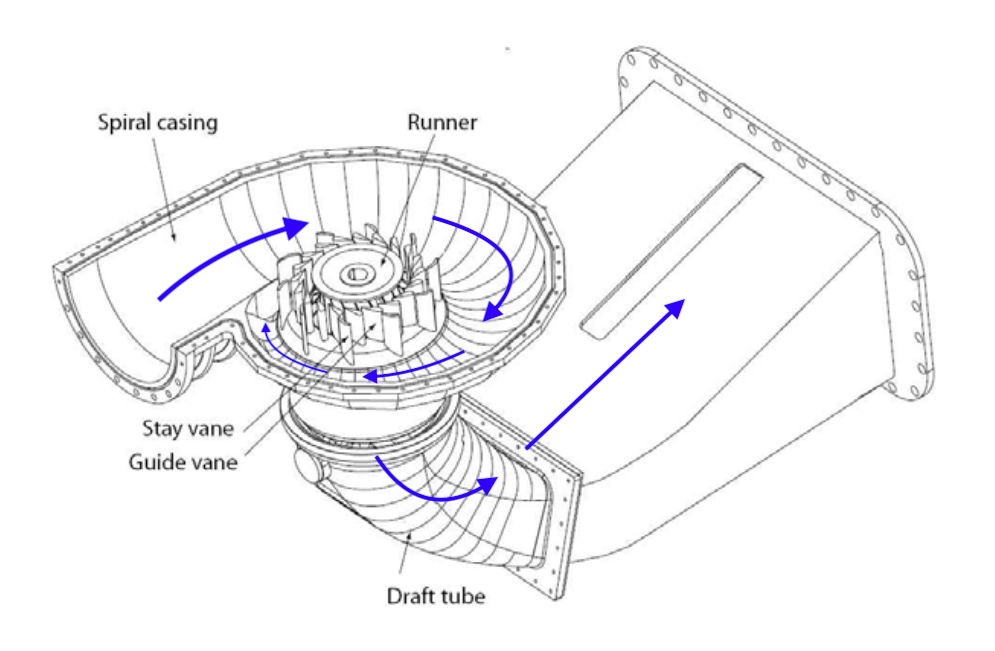
Figure 1: Francis Turbine
For our closed-loop PSH, the Mechanical Engineering team has chosen the Francis turbine. This design involves water coming into the turbine horizontally, rotating around the turbine, and being output at the bottom. This turbine is the most common in hydropower systems because of its high efficiency, which is due to the turbine rotating at an almost constant speed regardless of water flow. These turbines are versatile as well, allowing for varied amounts of water to be pumped up and down (required for a PSH system).
Pump Control Diagram

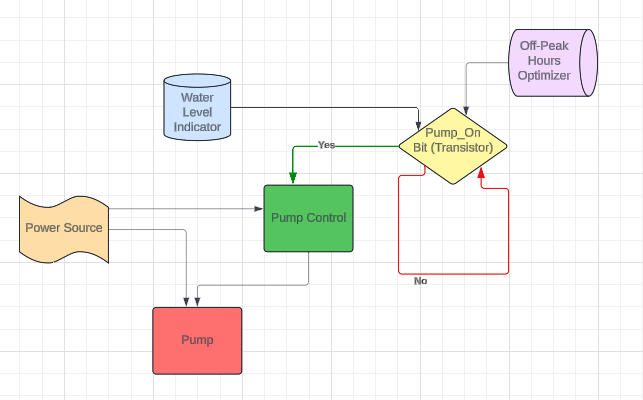
Figure 2. Pump Control Diagram
As pictured in figure 2, the process to turn the pump on will be primarily controlled by the pump_on bit. Depending on if this bit is one or zero, the pump will be turned on and water will be pumped from the lower reservoir to the upper reservoir. The pump_on bit will have two inputs, the water level indicator and the off-peak hours optimizer. The water level indicator will be used to turn the pump off, and make pump_on equal to zero, when the water level of the lower reservoir drops below a certain height. The off-peak hours optimizer will take data from the load, customer or grid, and determine if the pump should be turned on when off-peak hours are active and the power usage is low. The pump control will take a pump_on equaling one as a signal to turn the pump on, while a pump_on equaling one will turn the pump off.
Turbine to Load Transmission Diagram

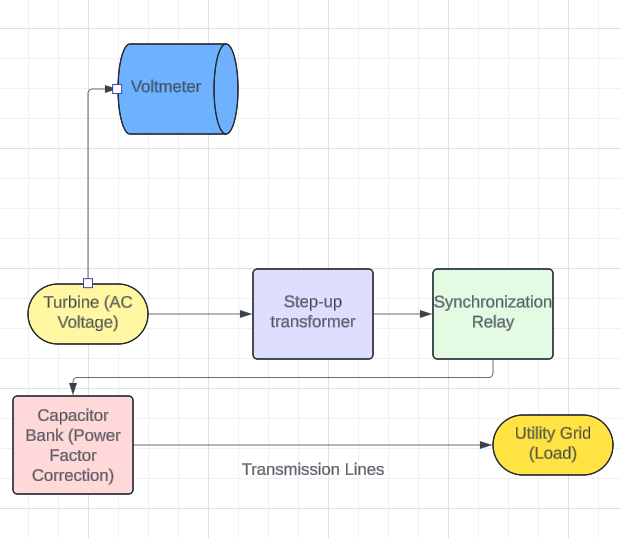
Figure 3. Transmission Diagram
As seen in figure 3, there are multiple components that go into the design of the power transmission from the turbine to the utility grid. When power is generated from the turbine, it will be fed into a voltmeter to monitor the power output. Additionally, it will be fed through a step-up transformer, in order to make the power suitable for transmission. After the power is stepped-up, it will go through the synchronization relay to match the frequency to the proper transmission frequency. Then it will go into the a bank of Capacitors, allowing for the power being delivered to be as close to purely resistive as possible. In turn this will improve the power factor and efficiency, and stabilize the power flow. Then the power will flow through the transmission lines to the utility grid.
