PROJECT

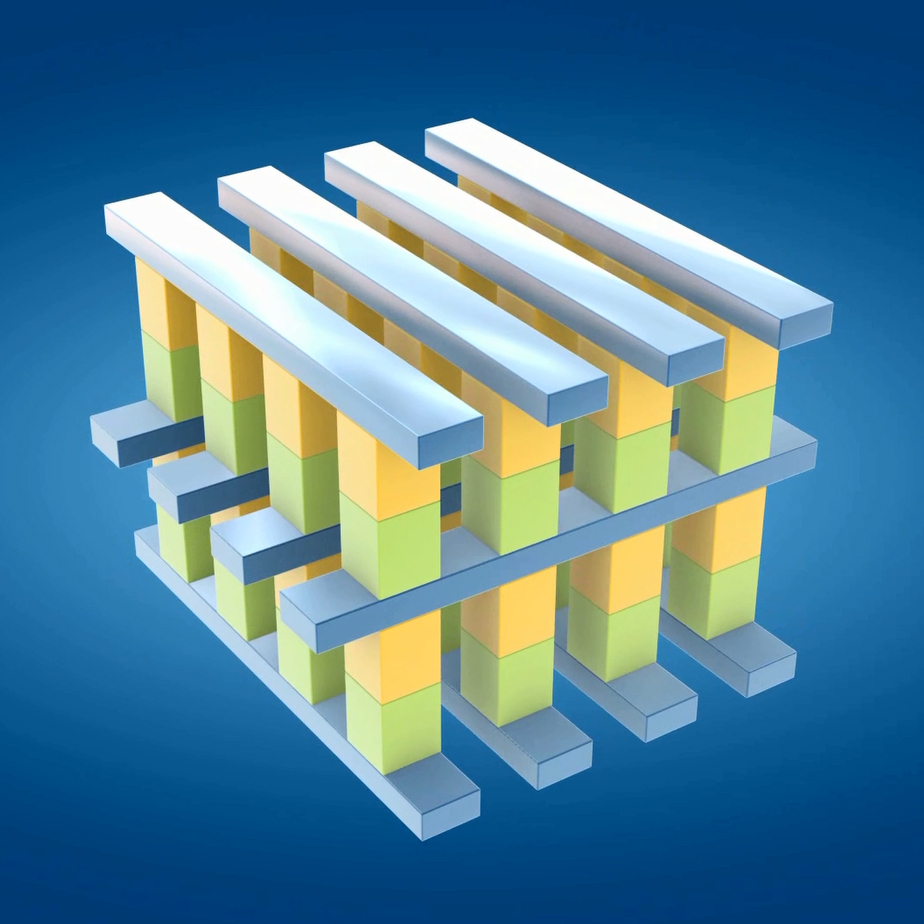
The overall goal for our Capstone research is to create and test a 1 Selector to 1 Memristor (1S1R) RRAM device. In order to do this we will need to first fabricate the device, followed by vigorous testing, and concluded with evaulation and analysis.
With such a large goal, we will be breaking up this project into two different parts spread across two semesters. In the Spring 2022 semester, we are aiming to successfully fabricate and test a NbOx (Nabium-Oxide) Selector device, to eventually be paired with a promising Memristor device in the Fall 2022 semester.

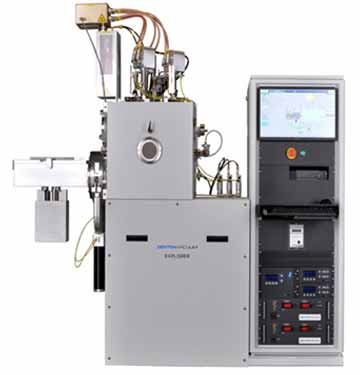
In order to fabricate our Selector sample devices, we will be using a Electron-Beam Vapor Deposition machine. The process involves creating a high voltage (~10kV) electron beam, that is able to be positioned by user input, though changing the electromagnetic field inside of the vaccum chamber. Once the beam is positioned into the crucible holding our material, the Ebeam will vaporize the material on contact, resulting in material vapors rising to our hanging sample at the top of the vaccum chamber.
When depositing Thin-Film sections, the use of a shadow mask will not be needed; however, shadow masks will be needed whenever deposting and edged layer of material. The shadow mask consists of five different feature sizes, and two different shapes.
If helices need to be deposited, a previously coded Python script is needed to run the stepper motor attached to the plate our sample will be hanging from. Only one parameter needs to be changed in teh script prior to running the program, with said parameter being reelated to the number of turns and radius associated with needed helices.

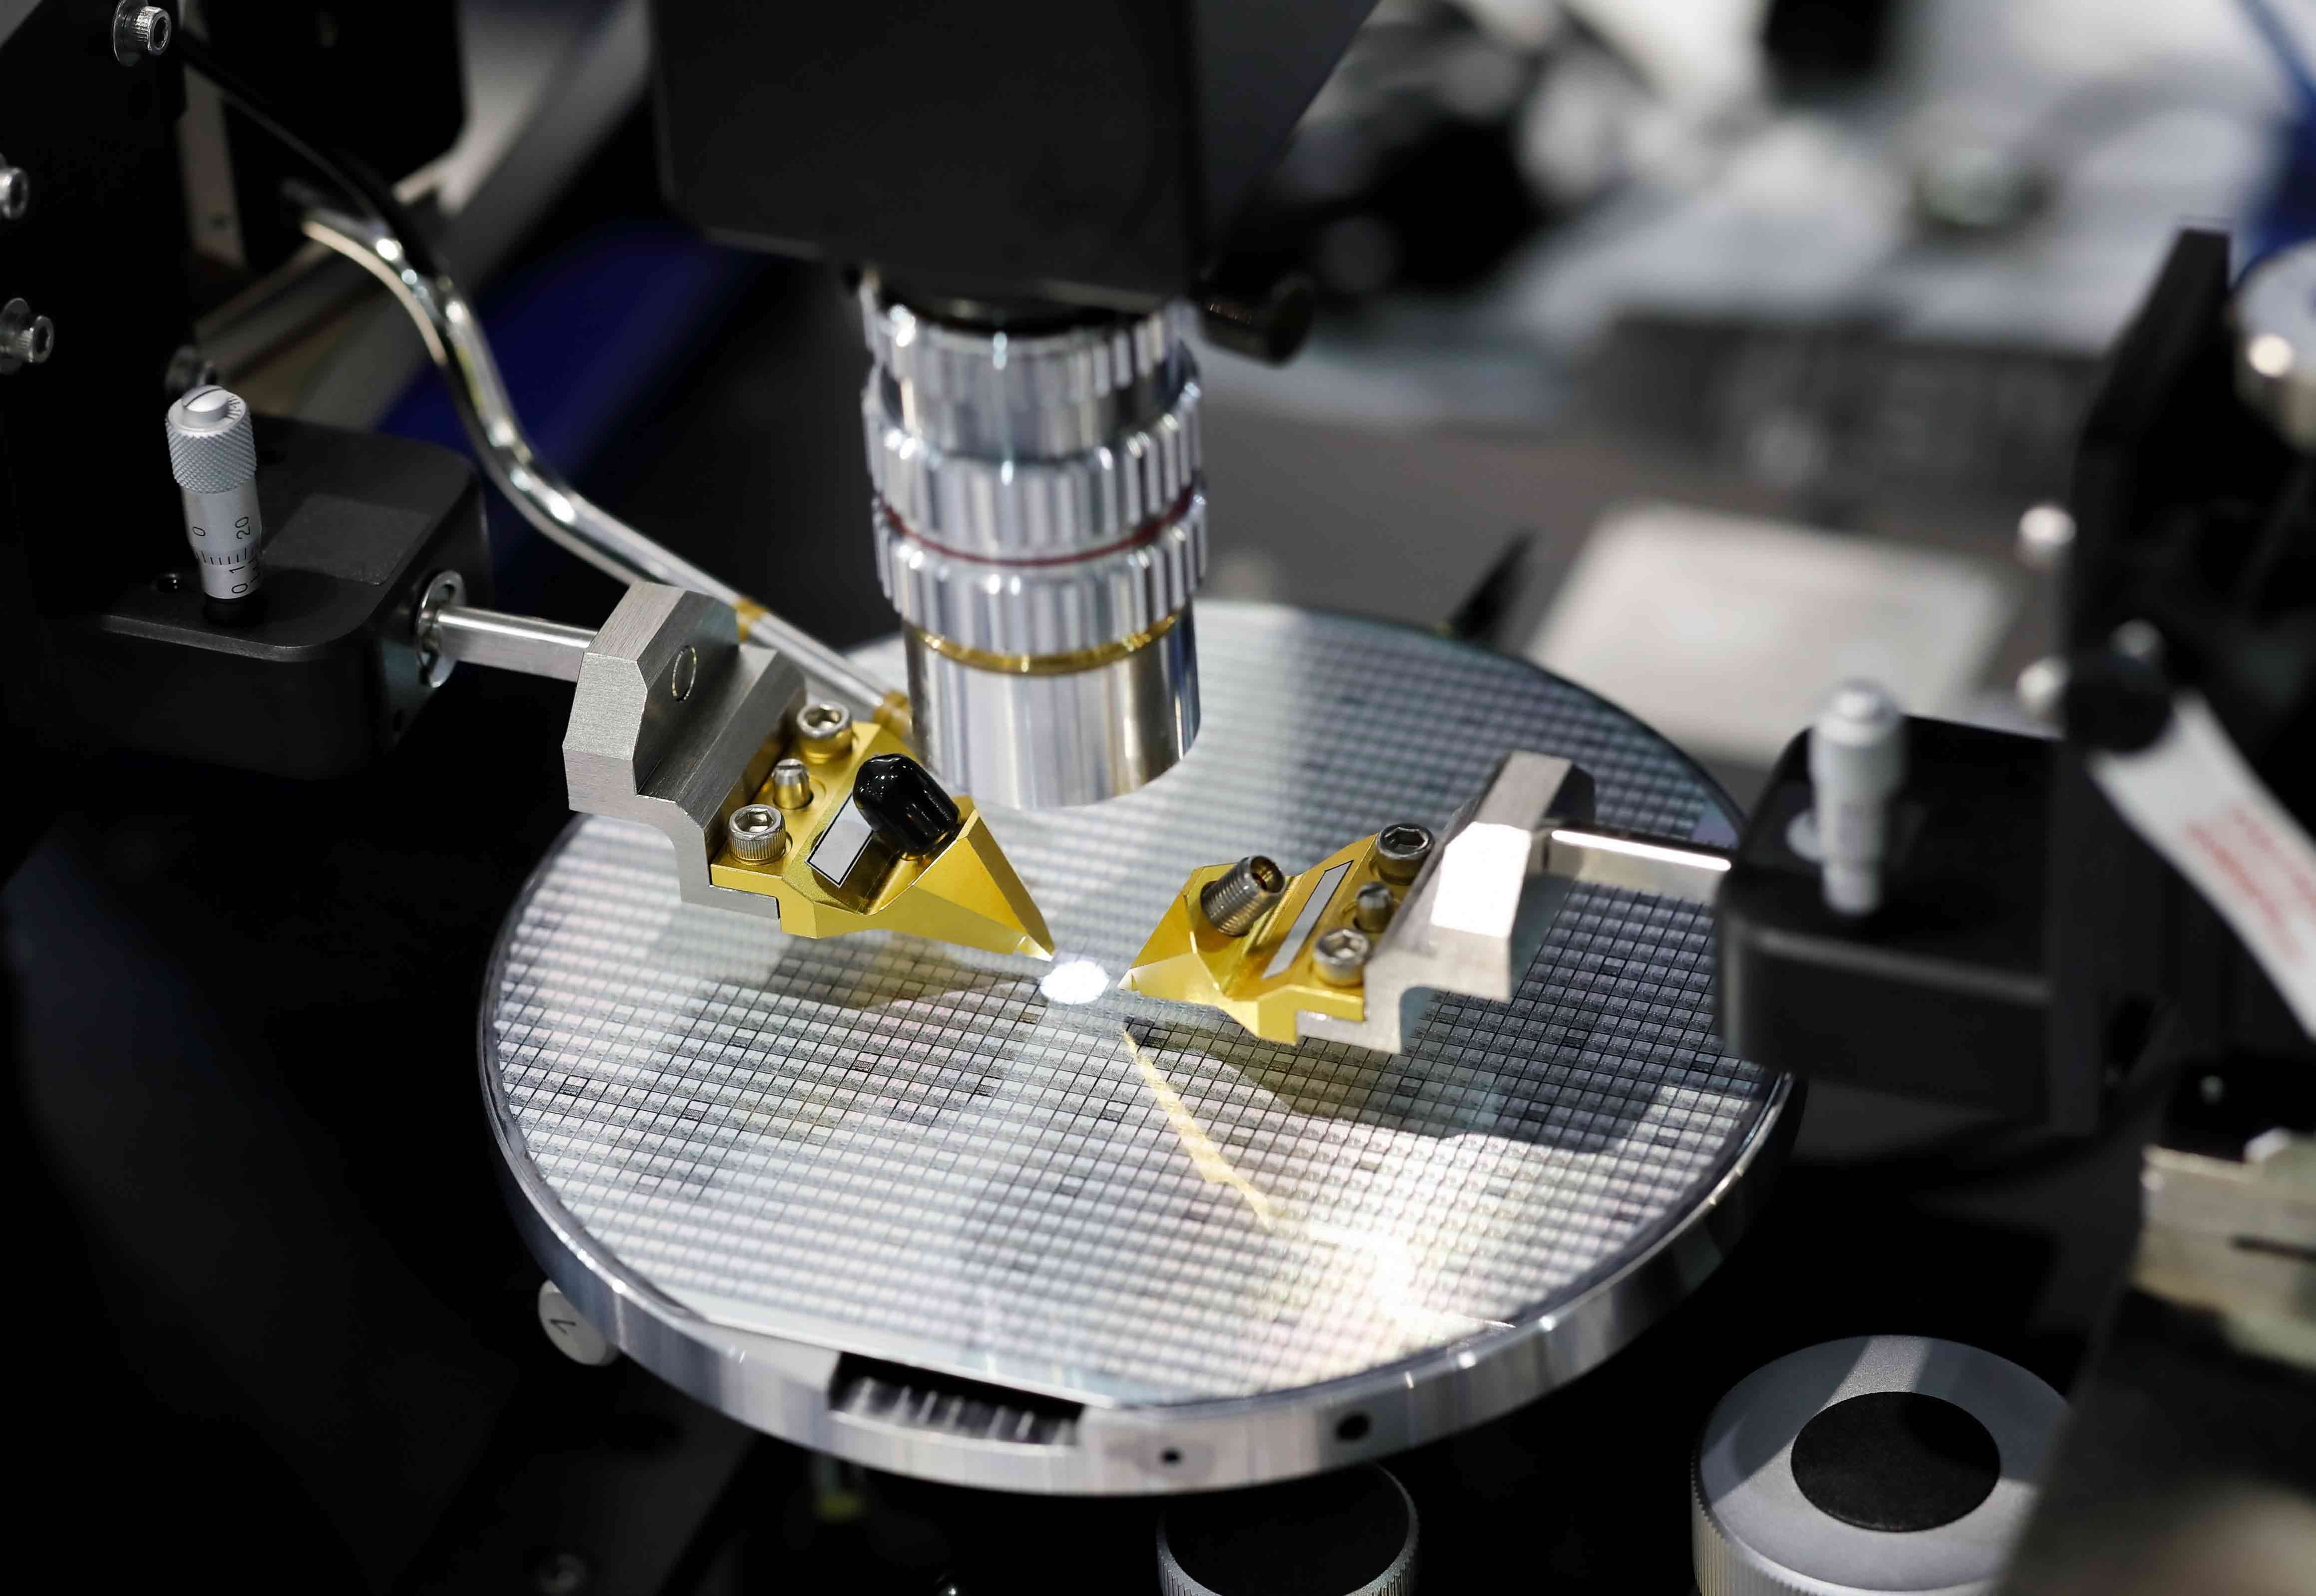
In order to test our devices, we will be using a Probe Machine. This machine will allow use to look through a microscope hooked-up to a monitor, and use micrometer sized probing tips to apply voltage to our samples. This process involves both human input and computer analysis. Human input is needed to move, land, and code the probes for proper use. Computer analysis automatically plots our I-V curve, and allows us to see potential ranges for turn-on and turn-off voltages. Furhter analysis pertaining to tempurature traits will be done in the future, but the process has not yet been taught to either member.
