The loss of tropical forests is a cause for global concern given that they play a vital role in
large-scale environmental processes. By absorbing vast quantities of CO2, tropical forests provide
oxygen and help stabilize the Earth’s climate. Furthermore, tropical forests help to maintain the
world’s water cycle through transpiration, generating clouds that travel all over the world. As for
biodiversity, “tropical forests contain over 30 million species of plants and animals... half of Earth’s
wildlife and at least two-thirds of its plant species!” These facts make it clear that tropical forests
need to be preserved and protected.
The importance of environmental protection cannot be overstated. It is crucial that forest ecologists
have access to and are able to interpret LIDAR-derived datasets such as canopy height, elevation, and
biomass estimates. These datasets are important for determining where specific species of plants and
animals may be found and studied. They also help gauge a forest’s overall health and amount of carbon
they store. The results of these studies help determine the environmental importance of the forest.
Conclusions drawn by the ecologists allow policymakers and conservationists to better understand
environmental changes and enact legislation to protect forests.
The aforementioned datasets can be obtained from LIDAR-equipped satellites, such as the International
Space Station with its onboard GEDI sensor. However, processing this data and visualizing it is a
non-trivial task. What forest ecologists need is an easy way to access the processed environmental data
in real-time while conducting their fieldwork. Such a tool is what the clients of this project have
tasked the team to create. They study megafauna within the forests of Africa and works closely with
ecologists working there. Their business is focused on learning about the environment and ensuring that
it is protected. Currently, the geographic data they use can be visualized using tools like Google Earth
Engine, but it is difficult to use and requires an internet connection. So forest ecologists are still
in need of a simple tool for visualizing environmental data and relevant maps while in the field.
Requirements
1) A mobile application with a dynamic map which can be centered onto a users location
using the devices GPS. Also, it will feature the ability to scroll and zoom in/out
with user gestures.
2) The stored map tiles will contain information about the canopy heights, above
ground biomass, and elevation. These datasets are very large in size and
will require a server capable of storing them.
3) Displaying and pulling new map tiles as the user navigates around the map. A buffer
around the current users location will be pulled to the device in order for a better
user experience
4) The application will be able to download chunks of tiles for offline use. This is
desired so the maps can be used during fieldwork, when cellular service is not guaranteed.
5) Multilingual support for the application will be implemented. The user can select
between French and English. Additional languages may be added in the future.
Solution Overview
Biomapper is an easy-to-use tool that’s intended to assist ecologists with their work in Africa. They no
longer need to have an understanding of programming and data processing to view the geographic data they
need. Instead, Biomapper displays preprocessed datasets on a navigable map. It also features tools that
help understand the map and locate regions of interest. Since it is a mobile application, users can
access the data wherever they go. This includes the ability to view maps offline. For datasets that are
included with the application, ecologists no longer need to print maps in advance of their fieldwork or
use their own sensors for data collection. Biomapper prevents the need for these rather involved tasks.
Finally, since many African countries containing tropical forests include French as an official
language, the application will include translations for both English and French.
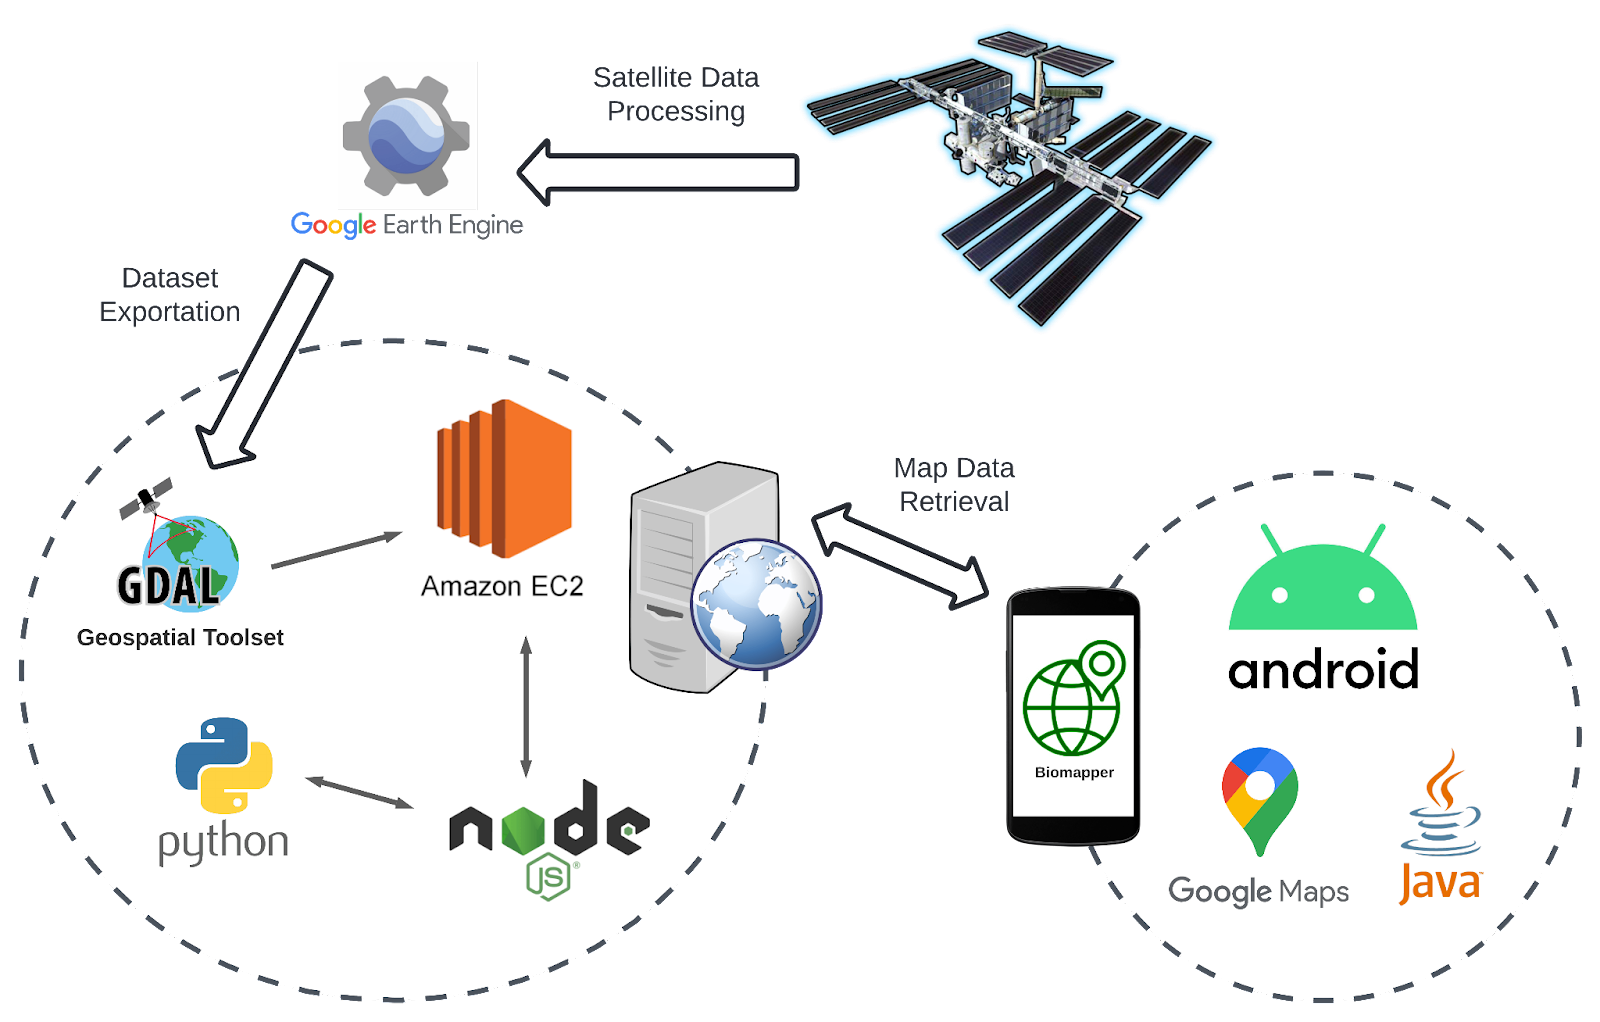
Technologies
Cloud-based infrastructure:
GDAL
GDAL is a library for reading and writing geospatial data formats. It is used to read and write
geospatial data in a variety of formats, including ESRI Shapefiles, GeoJSON, and many others. BioSphere
made use of this tool for tiling the rasterized datasets. The tiling process is a computationally
intensive process which is done prior to uploading the data to the server. To keep costs low, the server
is only setup to store the tiles and serve them to the application.
Node/Express API
The Node/Express API is a web service that allows communication between a user interface and back end
component. For Biomapper, it allows communication between the Android module and server module. To go a
little more in detail it listens for map tile requests from the Android module and responds accordingly.
Python Script
The Python script is a source file written in the Python programming language that's primary task is to
perform image processing on an unfiltered map tile. It is given the filter parameters by the
Node/Express API and returns the filtered map tile.
AWS Server
The file system on the EC2 instance is a standard Linux file system. The file system is not only
responsible for hosting the API and Python script, but also unfiltered and filtering of map tiles.
Android Application:
Native Android Intergace
The native Android interface is the core component of the Android module and is what the user interacts
with. The interface is responsible for displaying a map of various African countries with several data
types. It also allows the user to filter and toggle certain conditions for how they want the map to be
displayed.
GPS Navigation
The Android module is entirely dependent on the device’s navigation. The navigation pinpoints the user’s
location and displays the relevant data. When the user opens the application it defaults to the user’s
current location. These coordinates also provide a means of querying to the server module.
Device Storage
The device’s storage is needed, for when the user wants to go into offline mode due to not having a
network connection or whatever their situation may be. The user has the ability to input what data type
and the metrics they want saved to their device.
Demo
Downloading for offline use:
The application is designed to be used offline by allowing for the download the map tiles.
The user can select the data types they want to download and the filter values they want to apply before
downloading.
The user can also select the region of interest they want to download the map tiles for.
Filtering data values:
This demo shows a theoretical example of how a user can filter the data values on a map. Let's say that
a particular bird species only lives in canopy heights of between 22 and 28 meters. The user selects
these values to apply the filter, returns to the map and the map tiles are filtered to only show areas
in those heights. A user can then identify areas where the bird species can be found.