

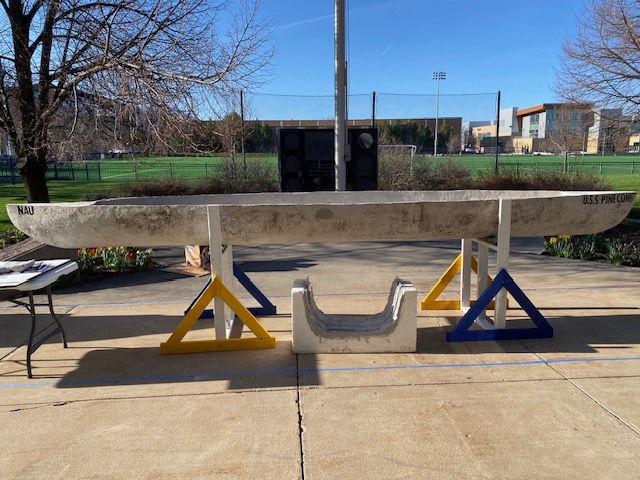
Figure 1: USS Pinecone on display in Logan, UT.
Credit: Kylie Hanson
Before the canoe was able to be the nice, polished product, there was a lot of hard hours and effort that went into making the USS Pinecone successful. In the sections below, the outline of how the mix design, reinforcement design, hull design, and structural analysis of the canoe can be seen.
First, the mix design started by gathering materials that met the qualification of being low density and lightweight. From here, the materials were proportioned out to create three different mix designs. The materials and the ratios can be seen below in Table 1.
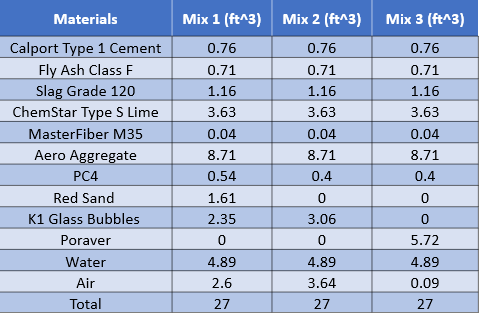
Table 1: Mix design material ratios.
Each mix had its different properties from different combinations of materials. These properties can be seen in Table 2 below. Since mix 1 was the winning mix, we did not report the values for the flexural strength of mix 2 and 3.
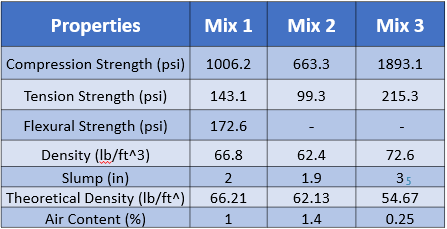
Table 2: Mix designs testing results.
To proceed with a mix design to use for the construction of the canoe we had to create a design matrix to score each mix about different aspects that we decided were important for the competition. These properties were dry weight, compression, tension, workability, cracking, and “green”. Green is for local, reusable material, and it’s an alternative material used for concrete construction. The scoring of each mix can be seen below in Table 3.

Table 3: Mix design decision matrix.
Back to TopFor the reinforcement alternatives, the team considered three types of reinforcing materials. The materials were judged based on weight, the tensile strength, and how available the material is. After judging and weighting the scores, the Carbon Fiber reinforcement from Simpson Strong Tie was the winner. The scoring and decision process can be seen in Table 4 below.

Table 4: Reinforcement Decision Matrix comparing the three materials.
Back to TopHull design was completed by modeling the different canoe body styles in solidworks. By creating the designs from stratch, the goal was to find a style of canoe that has great maneuverability and speed, but also stability and the looks of the canoe as well.
After creating the three proposed designs for the canoe body, each design was judged based on speed, aesthetics, buoyancy, maneuverability, and stability. This can be seen in Table 5 below. The winning design was design 3 due to mostly the buoyancy and stability performance.
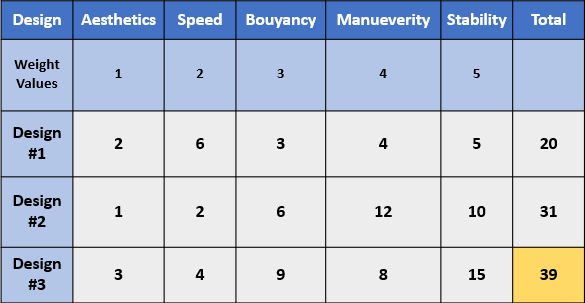
Table 5: Hull design decision matrix.
Back to TopStructural analysis is a critcal aspect of the canoe design. Without the proper and correct calculations, the canoe risk a sigficant chance of failing. In the section below, the diagrams and tables show the conditions which the canoe was design to withstand. In Figure 2, the free body diagram was created with th shear force and bending moment with the applied load.
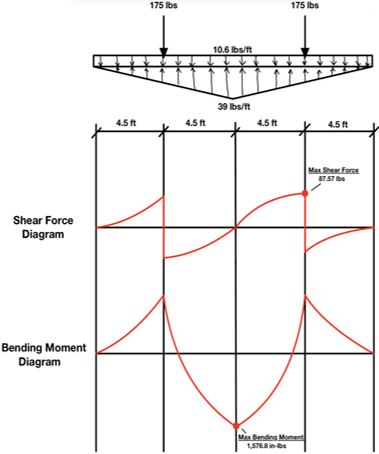
Figure 2: Free body diagram with shear force and bending moment diagrams.
In Tables 6, 7, and 8, the detailed result of the calculations for the loading of the canoe have been identified. This tells where the locations of the loading and the demands with the factor of safety (capacity) also listed. The freeboard is also calculated since this will ensure with the loading of people in the canoe that the walls do not go lower than the water level.
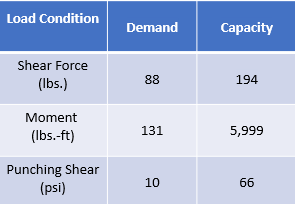
Table 6: Loading conditions of the canoe.

Table 7: Male tandem load of the canoe.
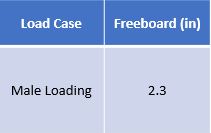
Table 8: Freeboard of the canoe.
Back to TopIn Figure 3, the blue circle in the graph is the max compressive strength and the yellow circle max is the tensile strength. The max compressive strength and tensile strength values are found in Table 3 Max Strength Table. The red lines connecting the two circles are the stress planes. Any points that happen inside the failure envelope won’t fail and the points that outside will fail.
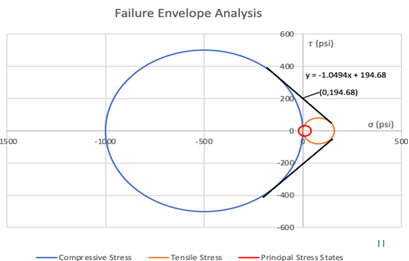
Figure 3: Failure envelop of the canoe.
For the final table, this describes the max compressive and tensile strength of the canoe. This tells how well the canoe can handle against loading and outside forces being applied. Table 9 details the numbers recorded in psi units.

Table 9: Compressive and tensile strength of the canoe.
Back to TopFor the team's project impacts, we tried to account for the social, environmental, and economical impacts. The comparison was between this year's concrete canoe and last year's concrete canoe. This was done by ways to compare what was good and bad between the two years. By highlighting this data, future years should also be able to see the differences of what worked and what needs improvement. In Table 10, you can follow the comparisons between the years for each catagory.
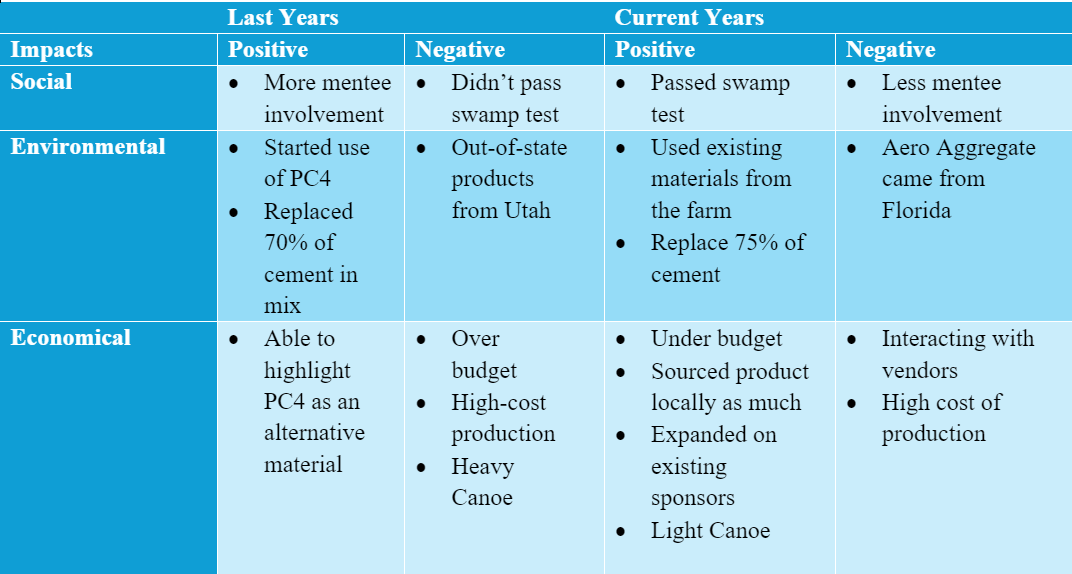
Table 10: Project Impacts.
For the impacts above, the scores were weighted with all of the components together. In Table 11, all of the scores can be seen to be added together and give a score comparing both years directly.

Table 11: Triple Bottom Line.
Back to Topcreated with
Website Builder Software .