

Because the list of species at this site is so extensive, and desert animals are not well-studied for chemical dose responses, the EPA ecological soil screening levels (Eco-SSLs) were used to determine ecological COCs for each of the four major groups.
Table 1. EPA Eco-SSLs by group
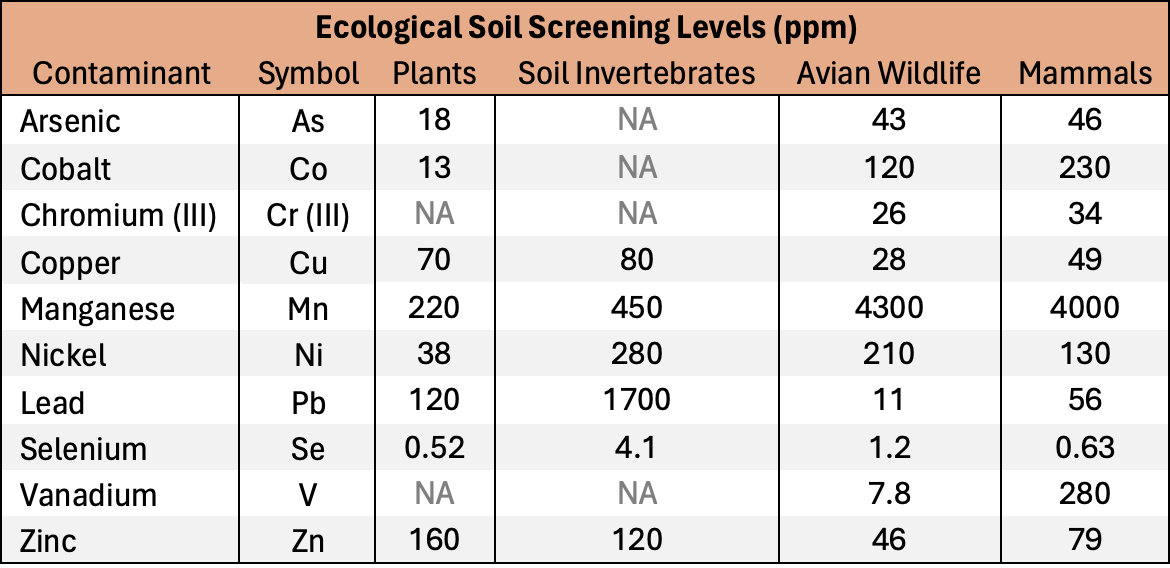
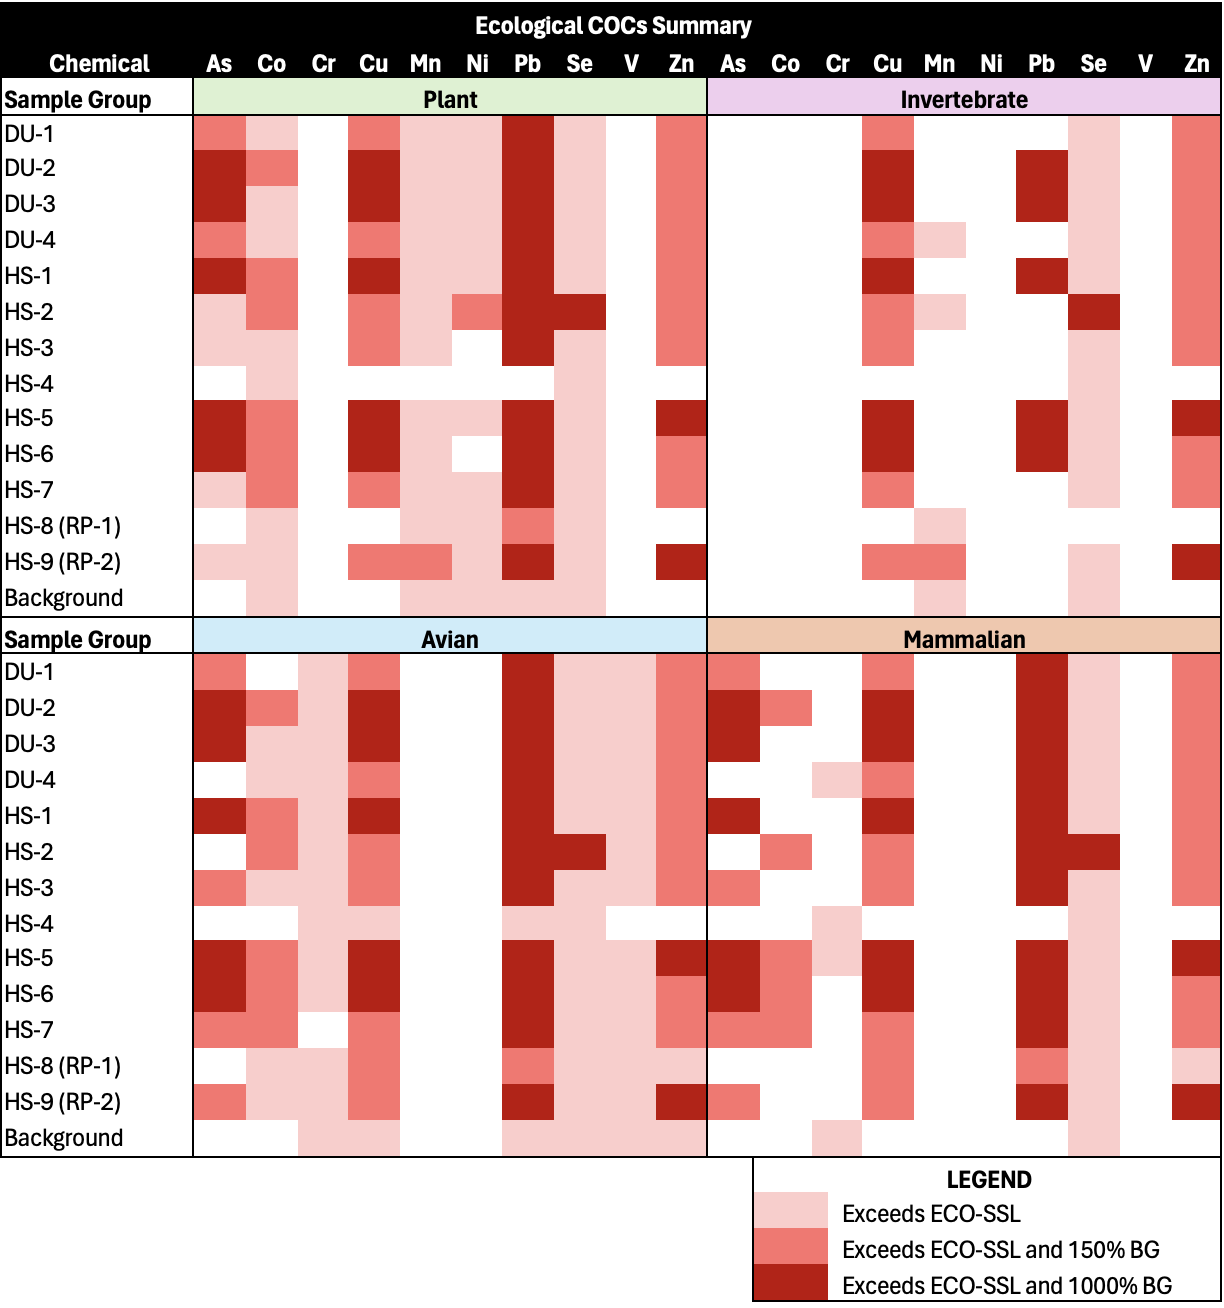
Table 2 shows the spatial distribution and heightened risk areas for each COC and ecological group. In this matrix, a blank (white) space indicates there is no effect of such contaminant on the listed ecological group. Light pink indicates that the sample (or 50% EPC for DU’s) exceeded the Eco-SSL. Because the background concentrations were often in excess of Eco-SSLs, the dark pink and red colors were added to indicate different levels of exceedance beyond the background levels. If a sample concentration exceeded Eco-SSL and 150% of the background level, the sample was marked dark pink. If the sample exceeded Eco-SSL and 1000% of the background level, the sample was marked red.
Table 2 . Summary of ecological COCs at each major sample point
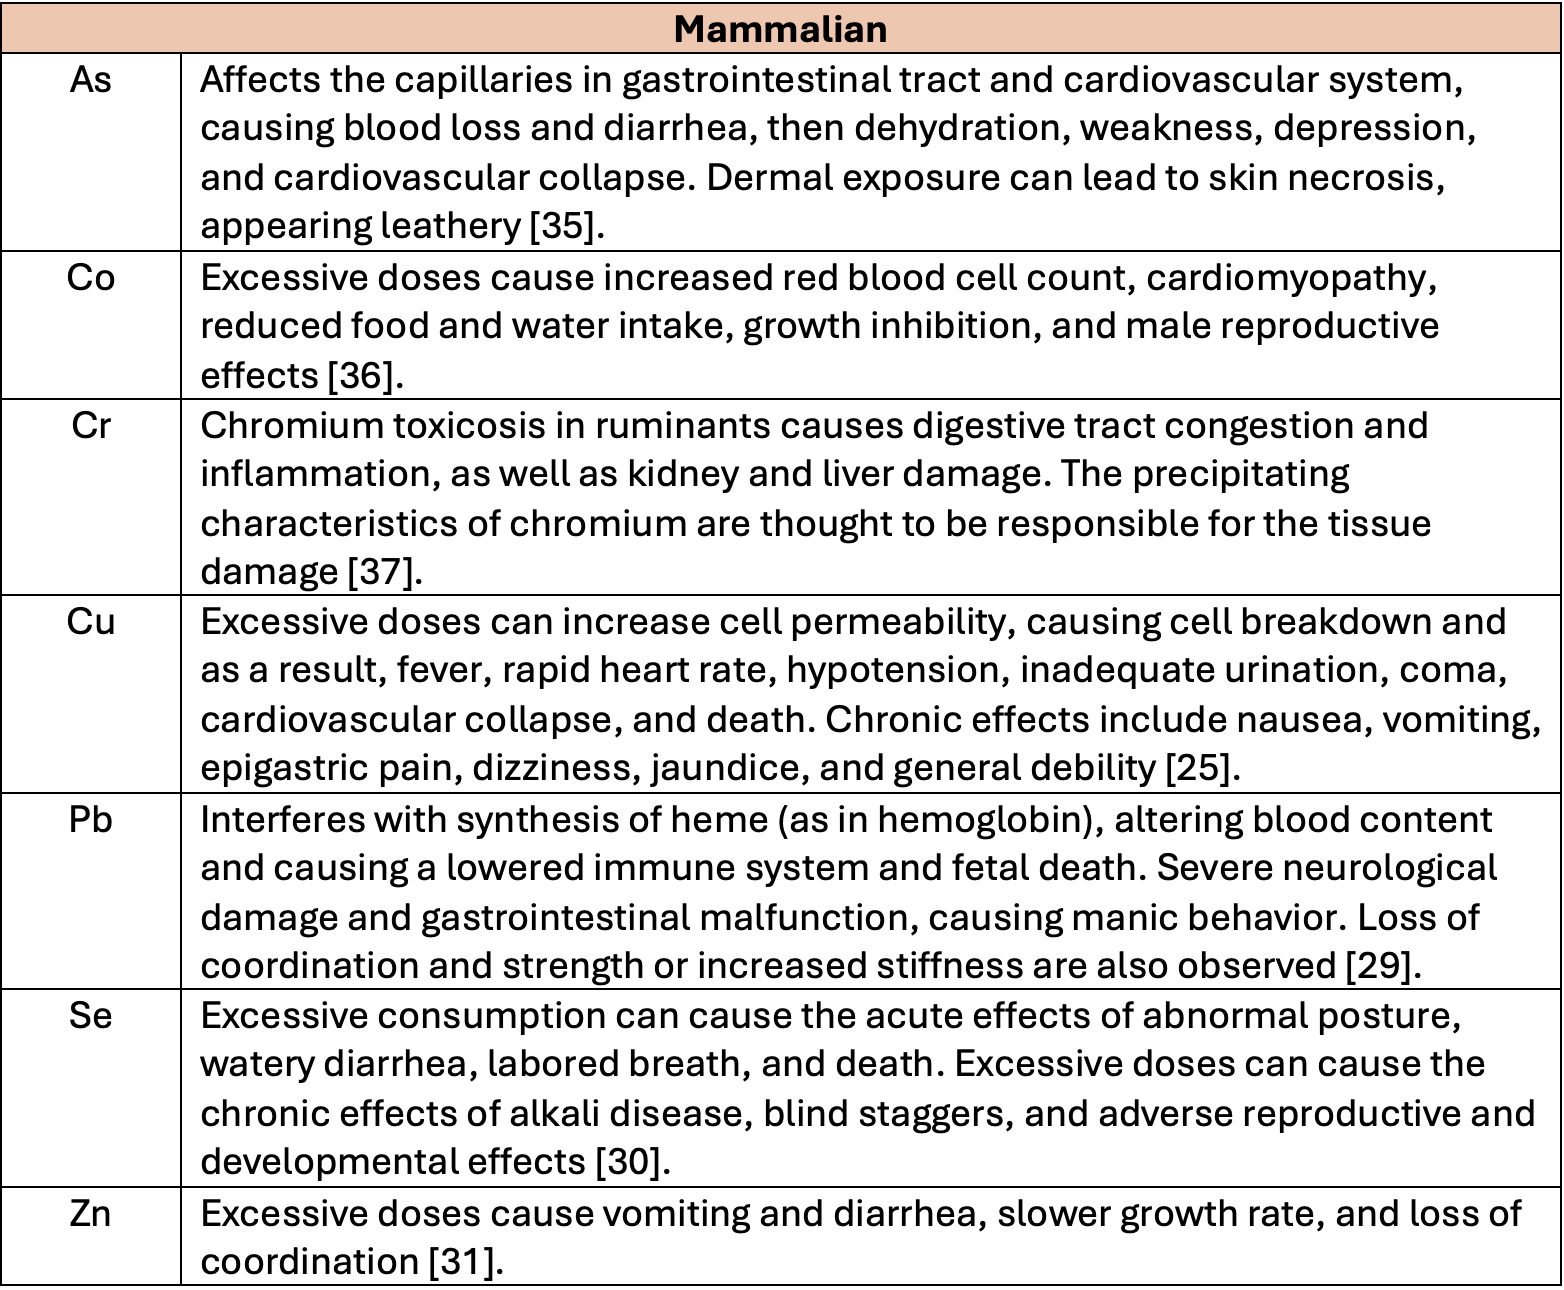
To assess the risk of wildlife and plant exposure to site contaminants, the health effects were researched. This research, shown in the following four tables, was conducted only for elements exceeding the Eco-SSL for any sample within each major ecological group.
Table 3. Health effects associated with each plant COC
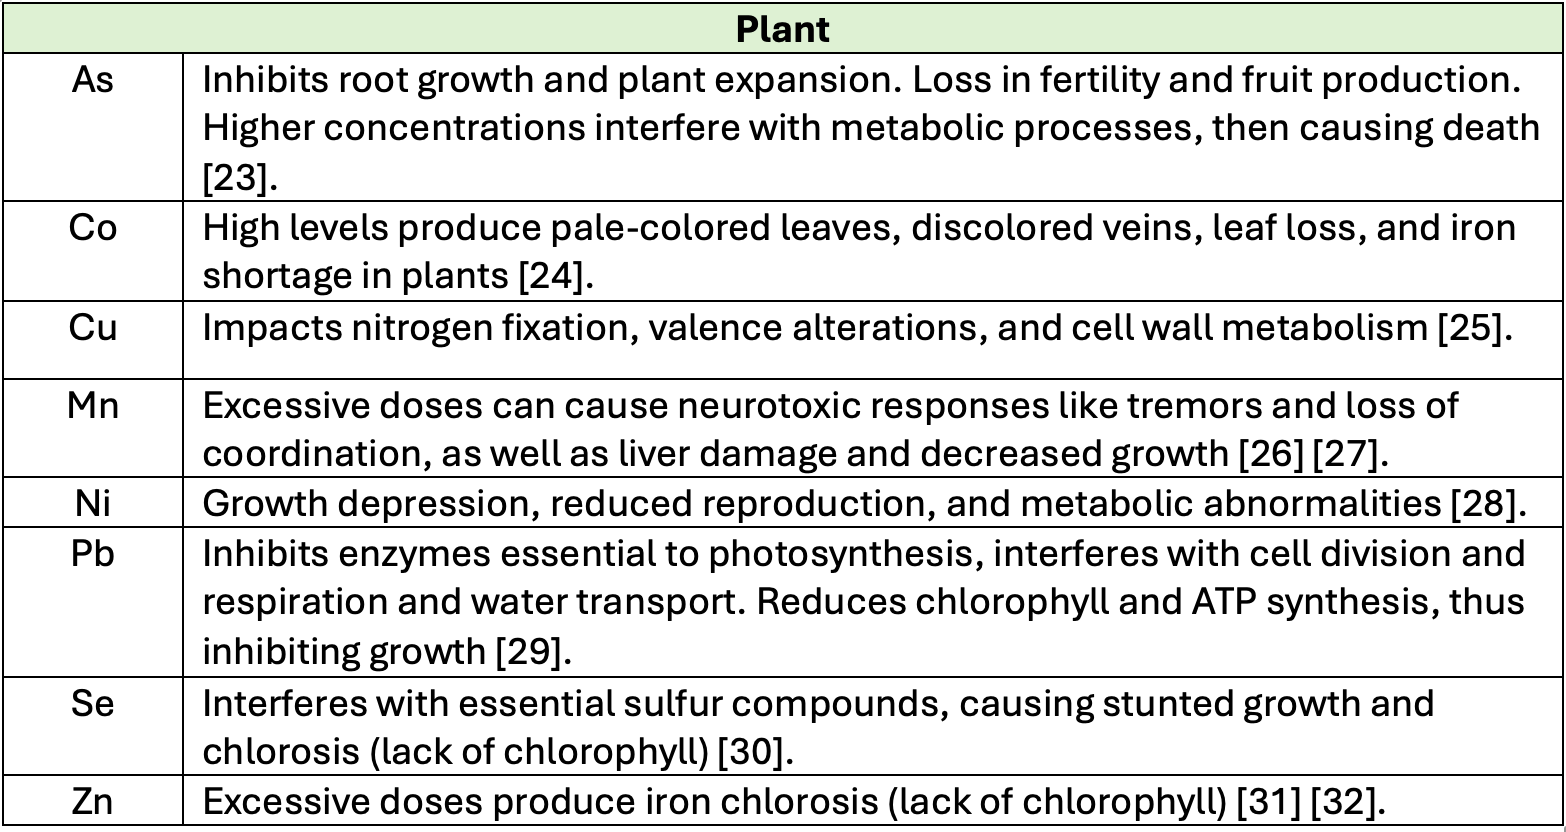
Table 4. Health effects associated with each invertebrate COC
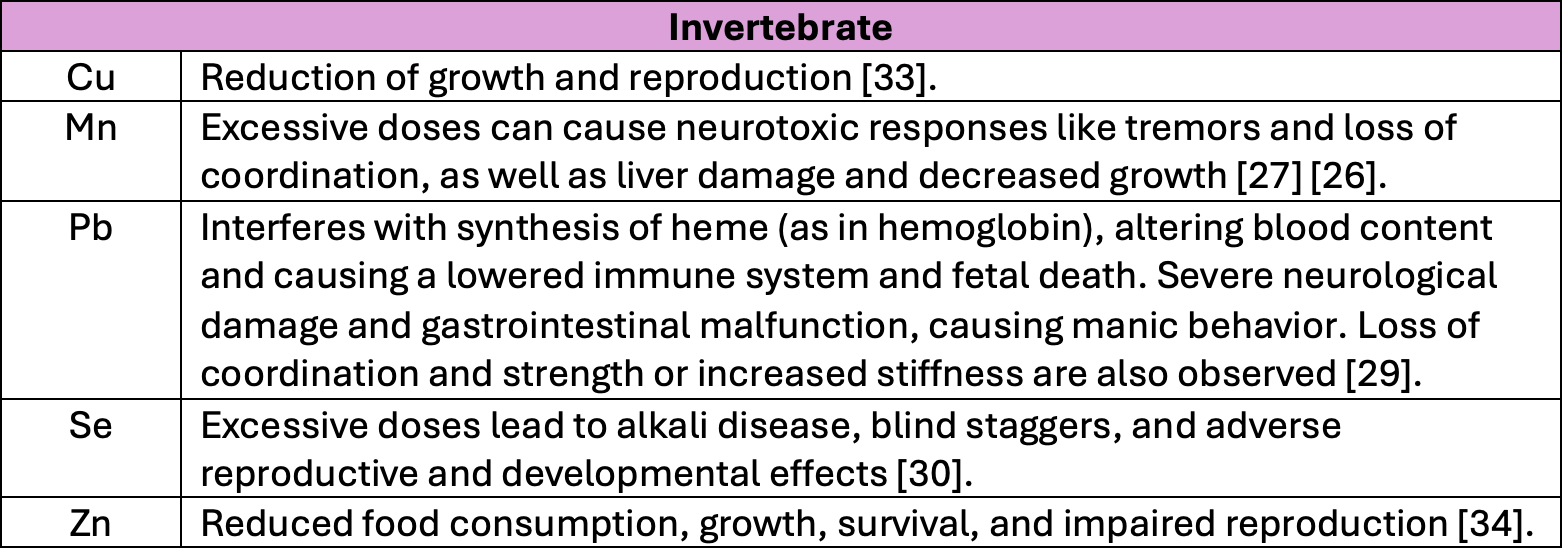
Table 5. Health effects associated with each avian COC
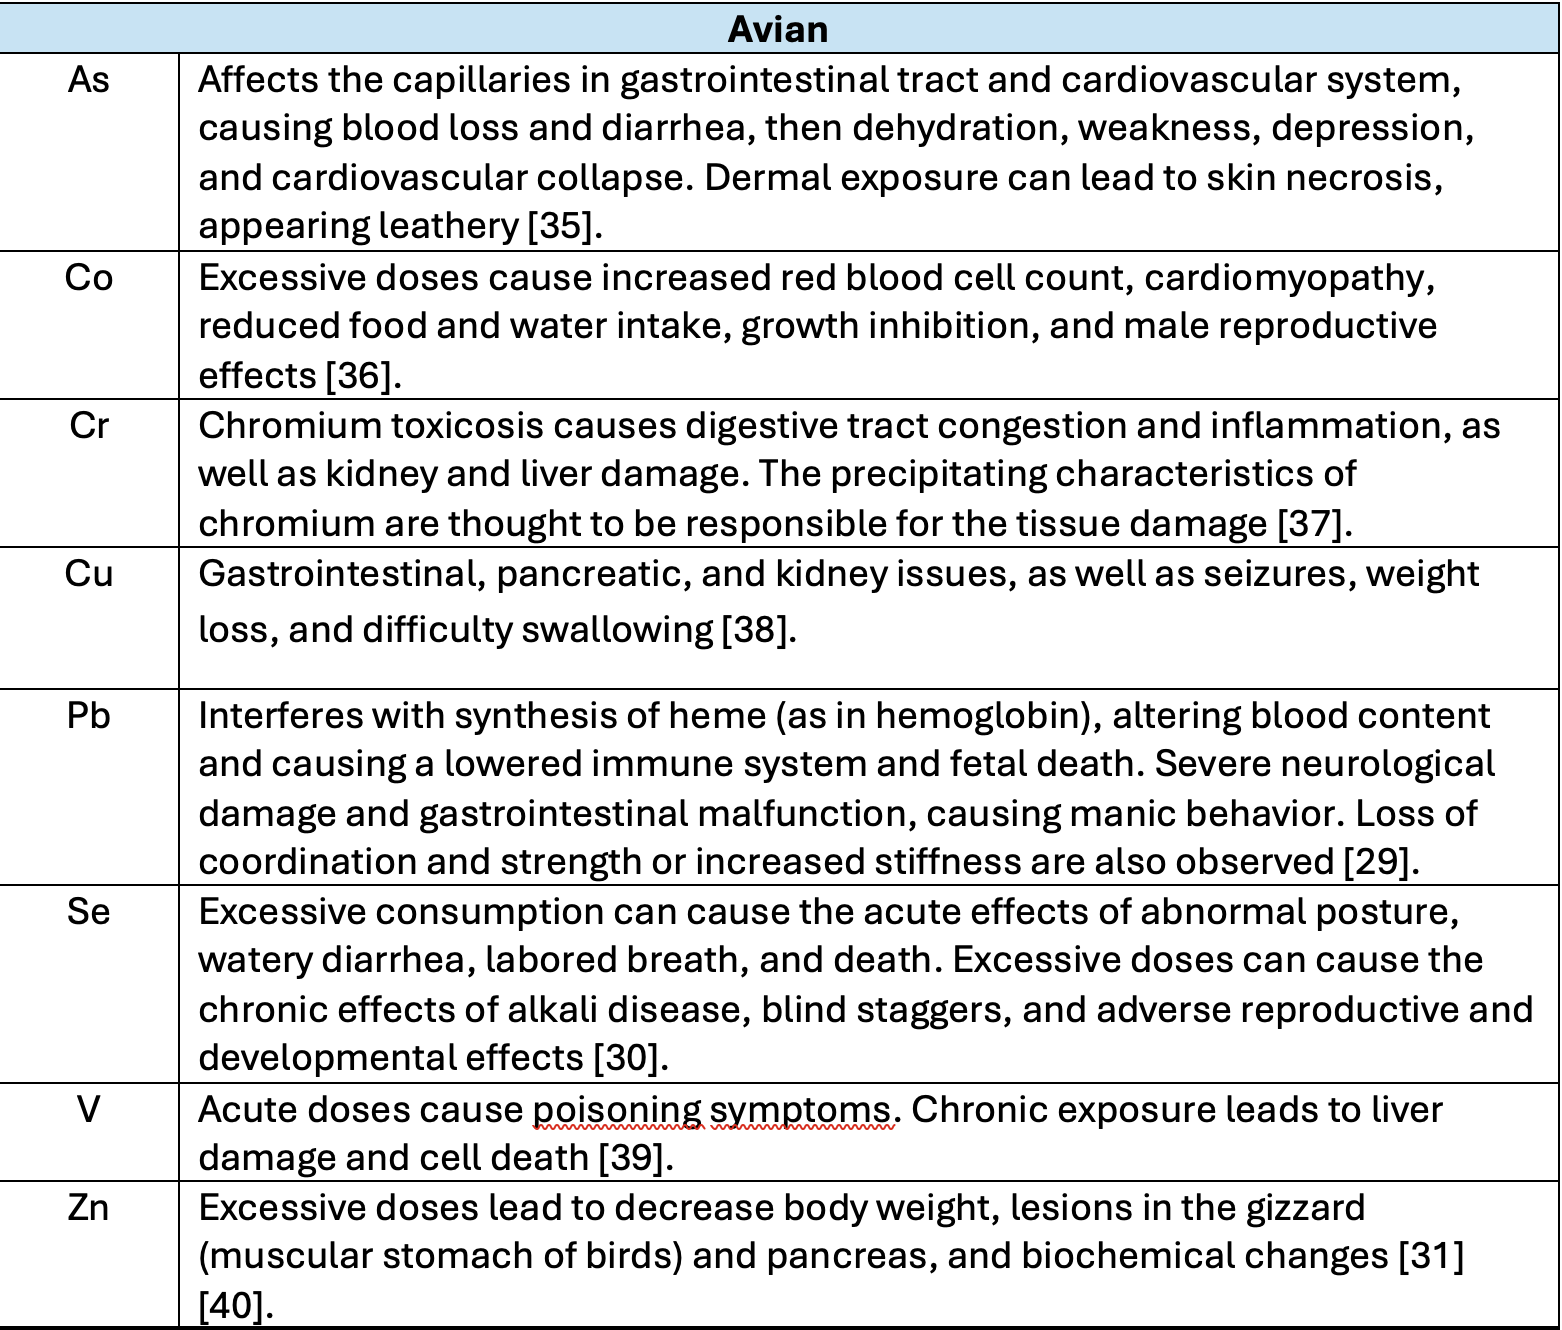
Table 6. Health effects associated with each mammalian COC
created with
HTML Designer .