Human Health Risk Assessment
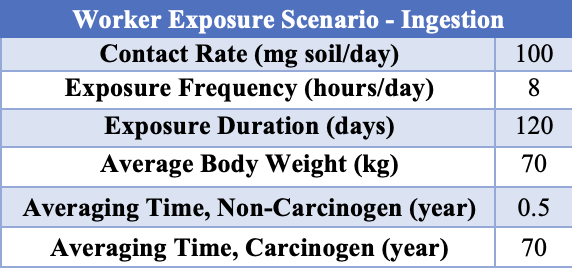
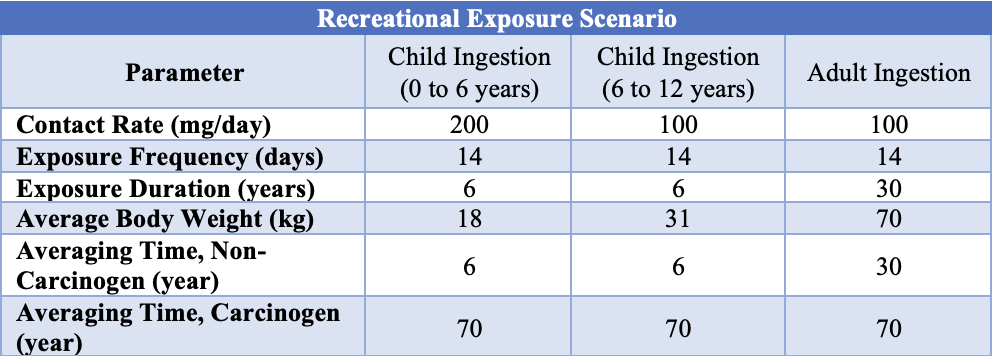
Human health risk was assessed for arsenic for two exposure scenarios. The following tables present the exposure assessment data for a worker and residential exposures scenarios.
Table 1: Worker Exposure Scenario
The following figure shows the spatial distribution map for arsenic contamination.
Table 2: Recreational Exposure Scenario
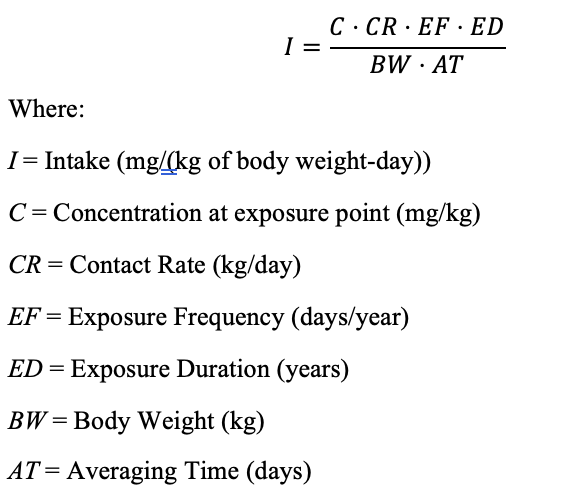
Intake doses were calculated using equation 1 below.
Equation 1: Intake Dose
Toxicity data for arsenic was sourced from the EPA's Integrated Risk Information System (IRIS) database. The following table displays the slope factor (SF) used for carcinogenic risk, and the reference dose (RfD) used for non-carcinogenic risk.
Table 3: Slope Factor and RfD
The following equations are used to calculate carcinogenic and non-carcinogenic risk. Carcinogenic risk is elevated if the risk is greater than 10E-6, and non-carcinogenic risk is elevated if the hazard index is greater than 1.
Equation 2: Hazard Index
Equation 3: Risk
The following table displays the 95% EPC risk for arsenic.
Table 4: 95% EPC Carcinogenic Risk
The following table displays the 50% EPC risk for arsenic.
Table 5: 50% EPC Carcinogenic Risk
There was no non-carcinogenic risk found at the site for the identfied COC.
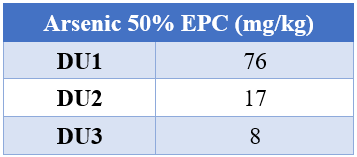
The following table displays the 50% EPC for arsenic.
Table 6: 50% EPC
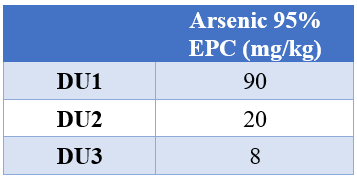
The following table displays the 95% EPC .
Table 5: 95% EPC
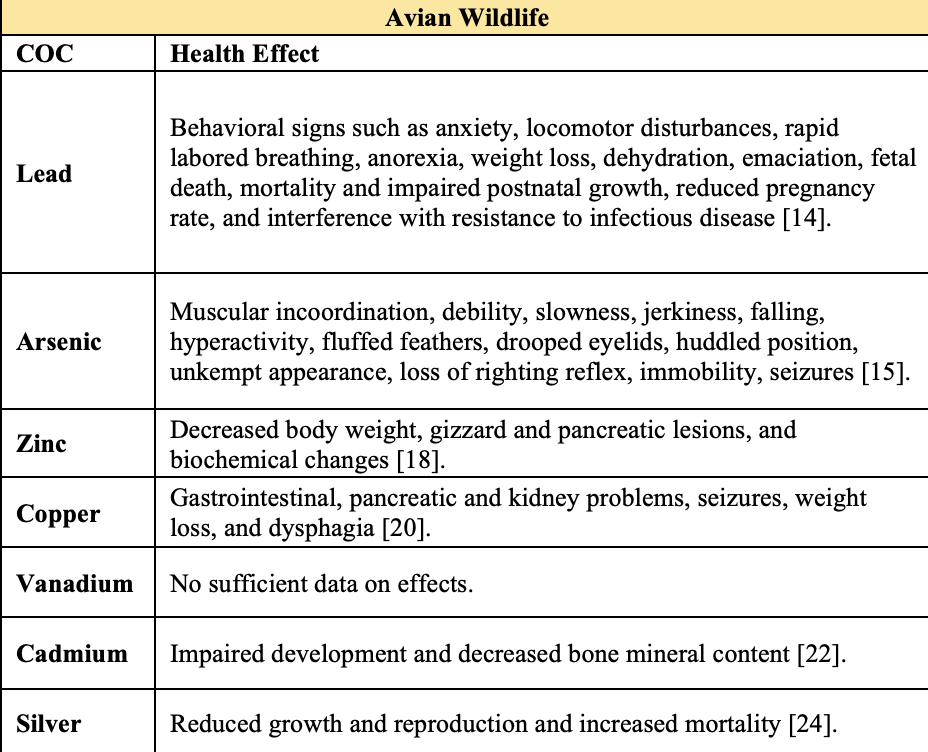
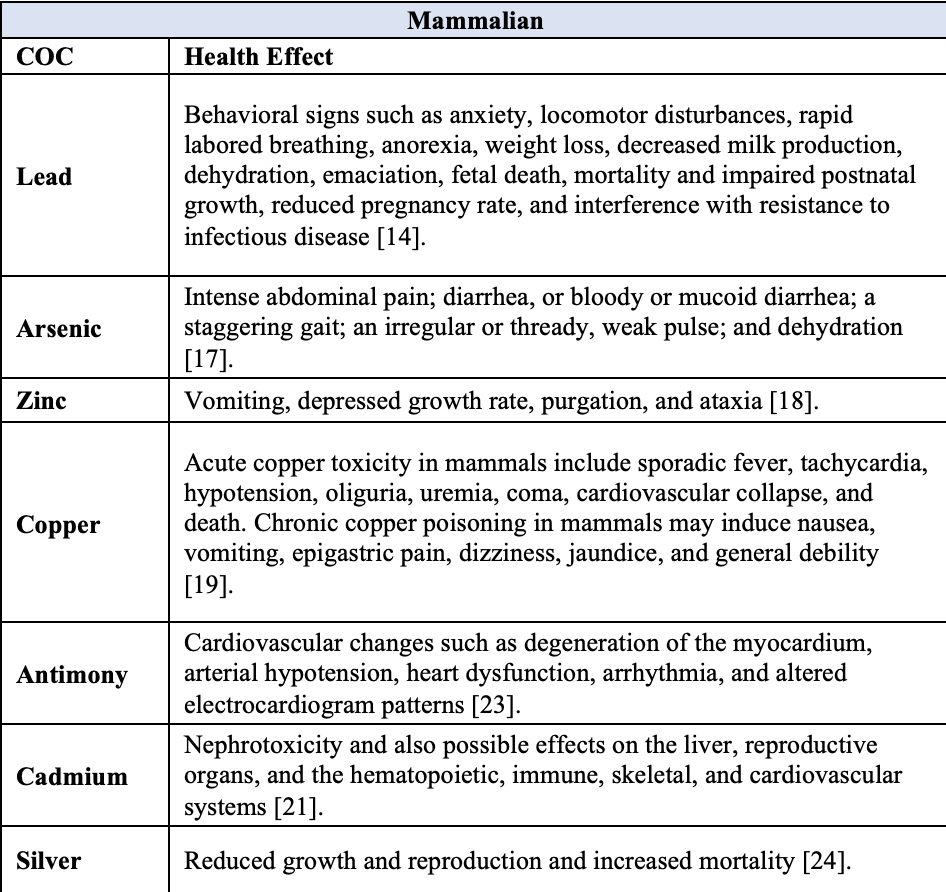
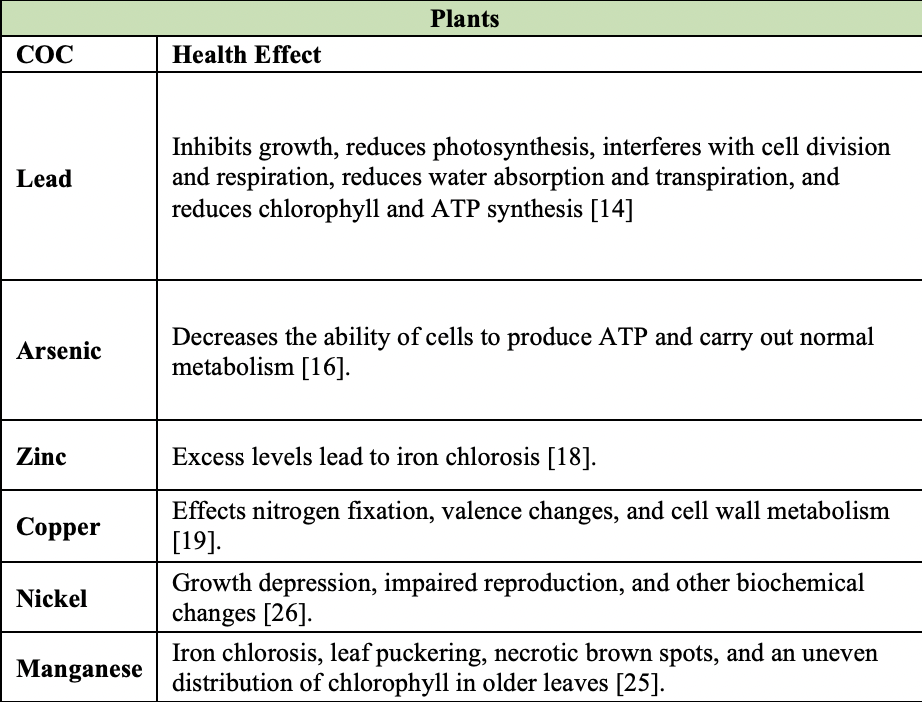
Carcinogenic effects may include skin, bladder, and lung cancer . Non-carcinogenic effects caused by arsenic may include vascular complications, abdominal pain, and heart attack .


.png)
