Final Design
Testing of Cylinders
The team acquired 20 normal weight and 6 light weight concrete cylinders to test. The cylinders were split evenly to complete compressive and split cylinder testing. Results of testing were to gather the compressive and tensile strengths of the concrete mixes. In the table below are the testing results.

Design Alternatives
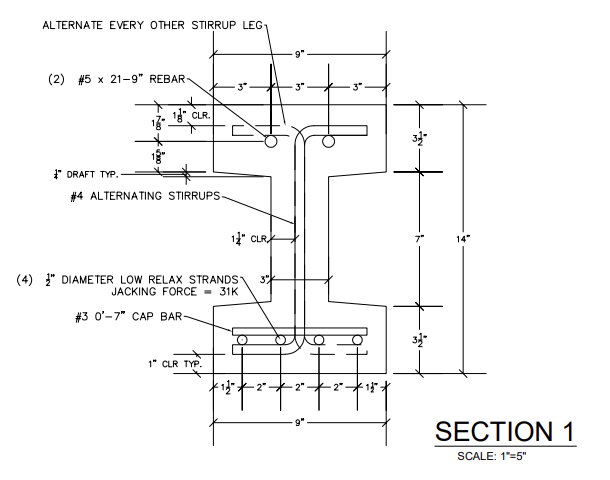
Below are the beam alternatives including the normal weight and lightweight concrete. They show cross sectional dimensions and steel reinforcement to scale.
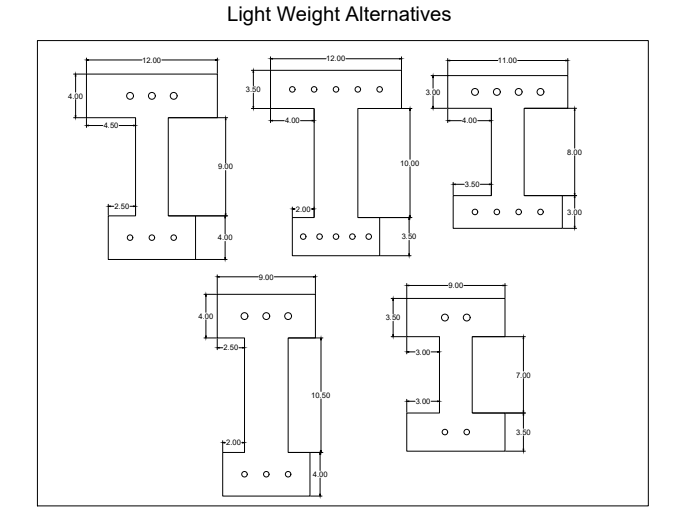
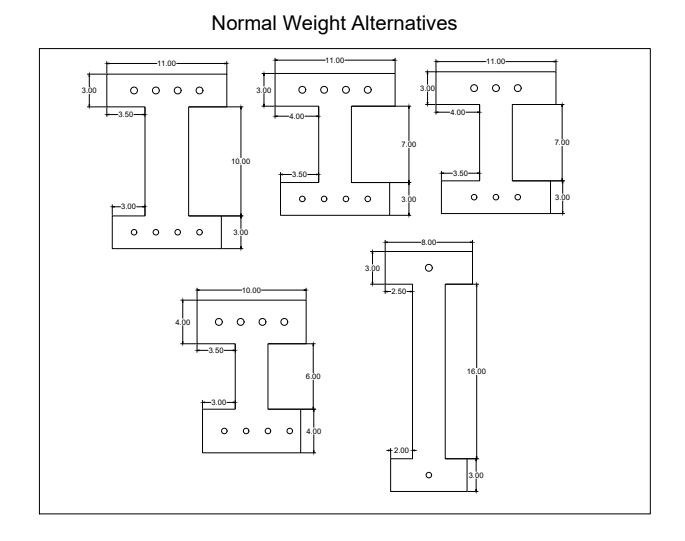
Excel predictions for all beam designs are shown in the table below.

Decision Matrices
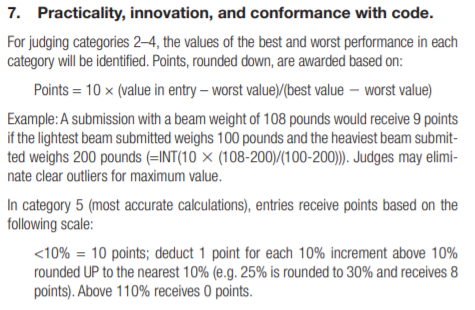
The decision matrix below was made to distinguish the performance between each design. As shown below, design 10 had the best score among all categories for each beam. Therefore, beam 10 was the beam we used for our final design. We weighted each category the same and gave them a total score out of 10 to base it off of the judging criteria given by the PCI Big Beam Competition as shown below.

Shear Design
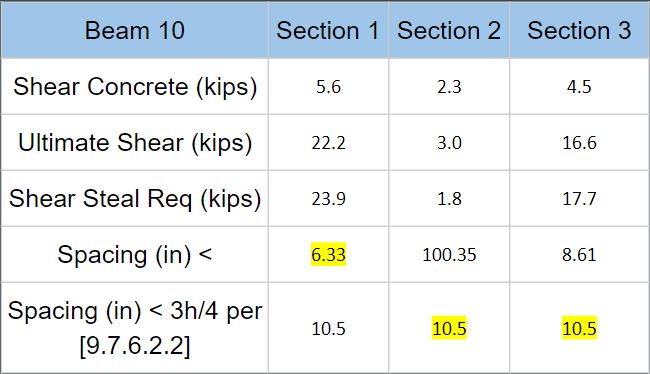
The shear design was done to measure the amount of stirrup reinforcement was required. The number and spacing of stirrups was calculated. In the table below details the important calculations.
Details of Final Design
The final beam design was constructed of light weight concrete mix, two number 5 strands in the top flange, four 1/2 inch diameter low relax prestressed strands along the bottom flange, number 4 alternating stirrups, and number 3 cap bars. The strands in the top of the beam are to help with compression. Prestressed strands in the bottom of the beam are used to prestress the bottom of the beam causing it to camber up and allow for the beam to sustain larger loads. Stirrups are to be spaced at 6 inches along the length of the beam as calculated within our shear design. The cap bars are placed to hold the down the prestressed strands. The cross section and placement of steel reinforcement can be seen in the figure to the right. The cross section is am I-Beam that is 9 inches wide and 14 inches tall. The beams length is 22 feet. Further details for the beam can be found under the documents tab under shop drawing.
Determine Losses
The losses within the prestressed strands over time occur from elastic shortening, creep, shrinkage and relaxation of tendons. The amount of loss of stress in the prestress strands was measured to be 17.152 ksi. Strain value was 0.006555 in/in.
Deflection and Camber
Deflection and camber was predicted. Deflection is the vertical displacement downwards and camber is the vertical displacement upwards measured in inches. The predicted deflection was 3.23 inches and the camber was 0.52 inches.
Beam Fabrication
The team went down to the TPAC facility to oversee the pour of our beam. We performed a quality check to ensure that the beam was designed how we intended and was displayed within the shop drawings. Once the quality check was done, they started to pour the concrete for our beam and 6 testing cylinders.
Final Predictions
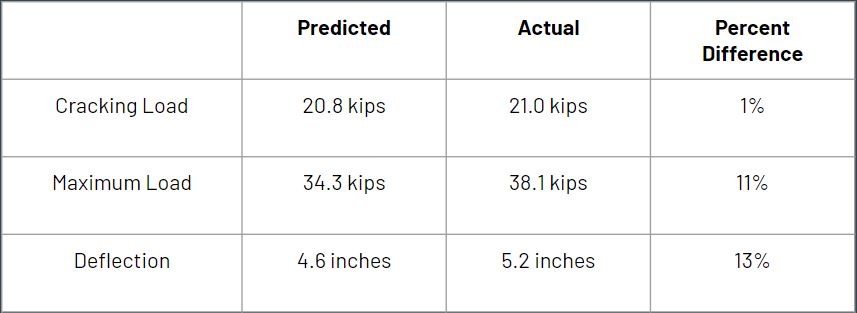
Using our predictions from the excel hand calculations and RESPONSE the team predicted a cracking load of 20.8 kips, a failure load of 34.3 kips, and a deflection of 4.6 inches.
Testing
Removal of the old beam was the first step to prepare the lab for testing. Once the beam arrived to NAU we placed our beam on the HULK and set it up for testing. Set up for testing included placing the hydraulic press in the correct location and setting it on the splitter. The splitter was used to evenly distribute the load between two separate loads 7 and 10 feet from the edge of support as specified by the PCI Competition. A device as then hooked to the bottom of the beam to calculate the amount of deflection occurred during testing. When the setting up was all complete the team was ready to test. The testing and results were recorded as a requirement for the competition.
Predictions versus Results
Below in the table are the comparison of our predictions with the results of testing.
