Fanning Wash at the Intersection of Steves Boulevard Drainage Design

FINAL PROJECT DESIGN

SITE INVESTIGATION HYDROLOGIC ANALYSIS HYDRAULIC ANALYSIS DESIGN ALTERNATIVES FINAL PROPOSED DESIGN CONSTRUCTION PLANS COST OF IMPLEMENTATION

Site Investigation

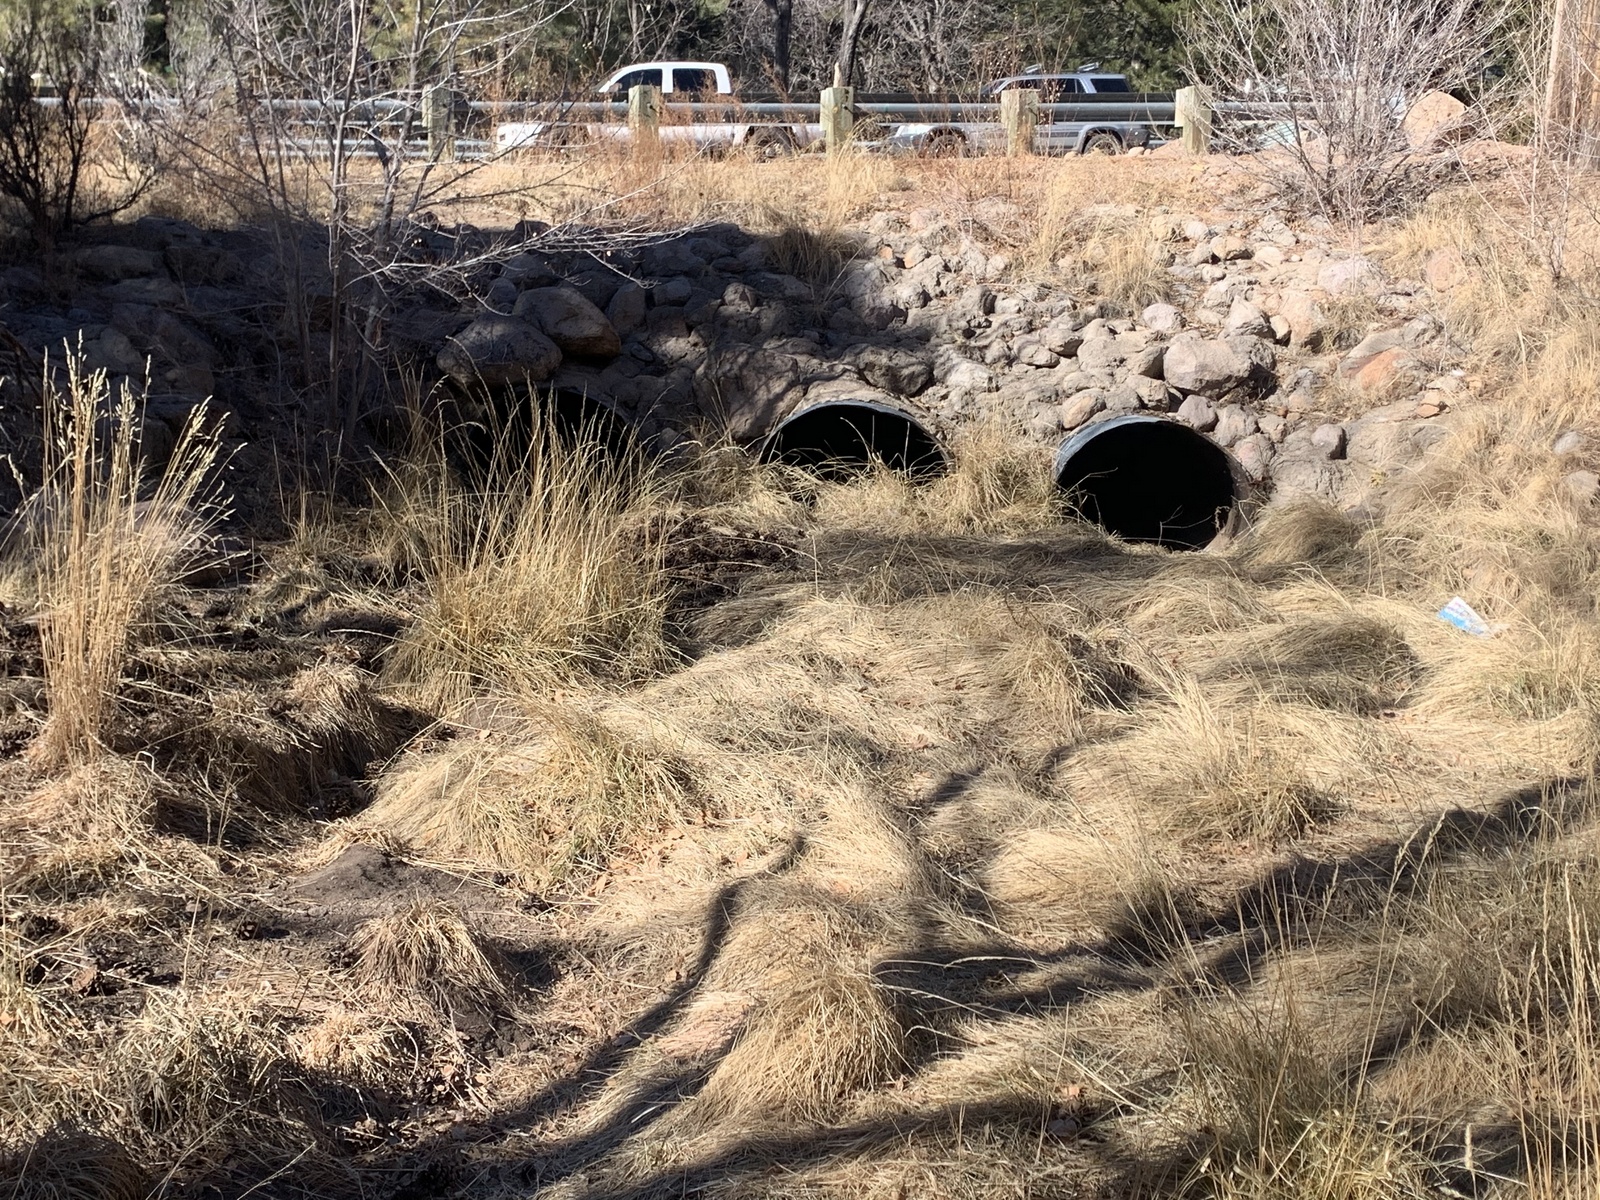
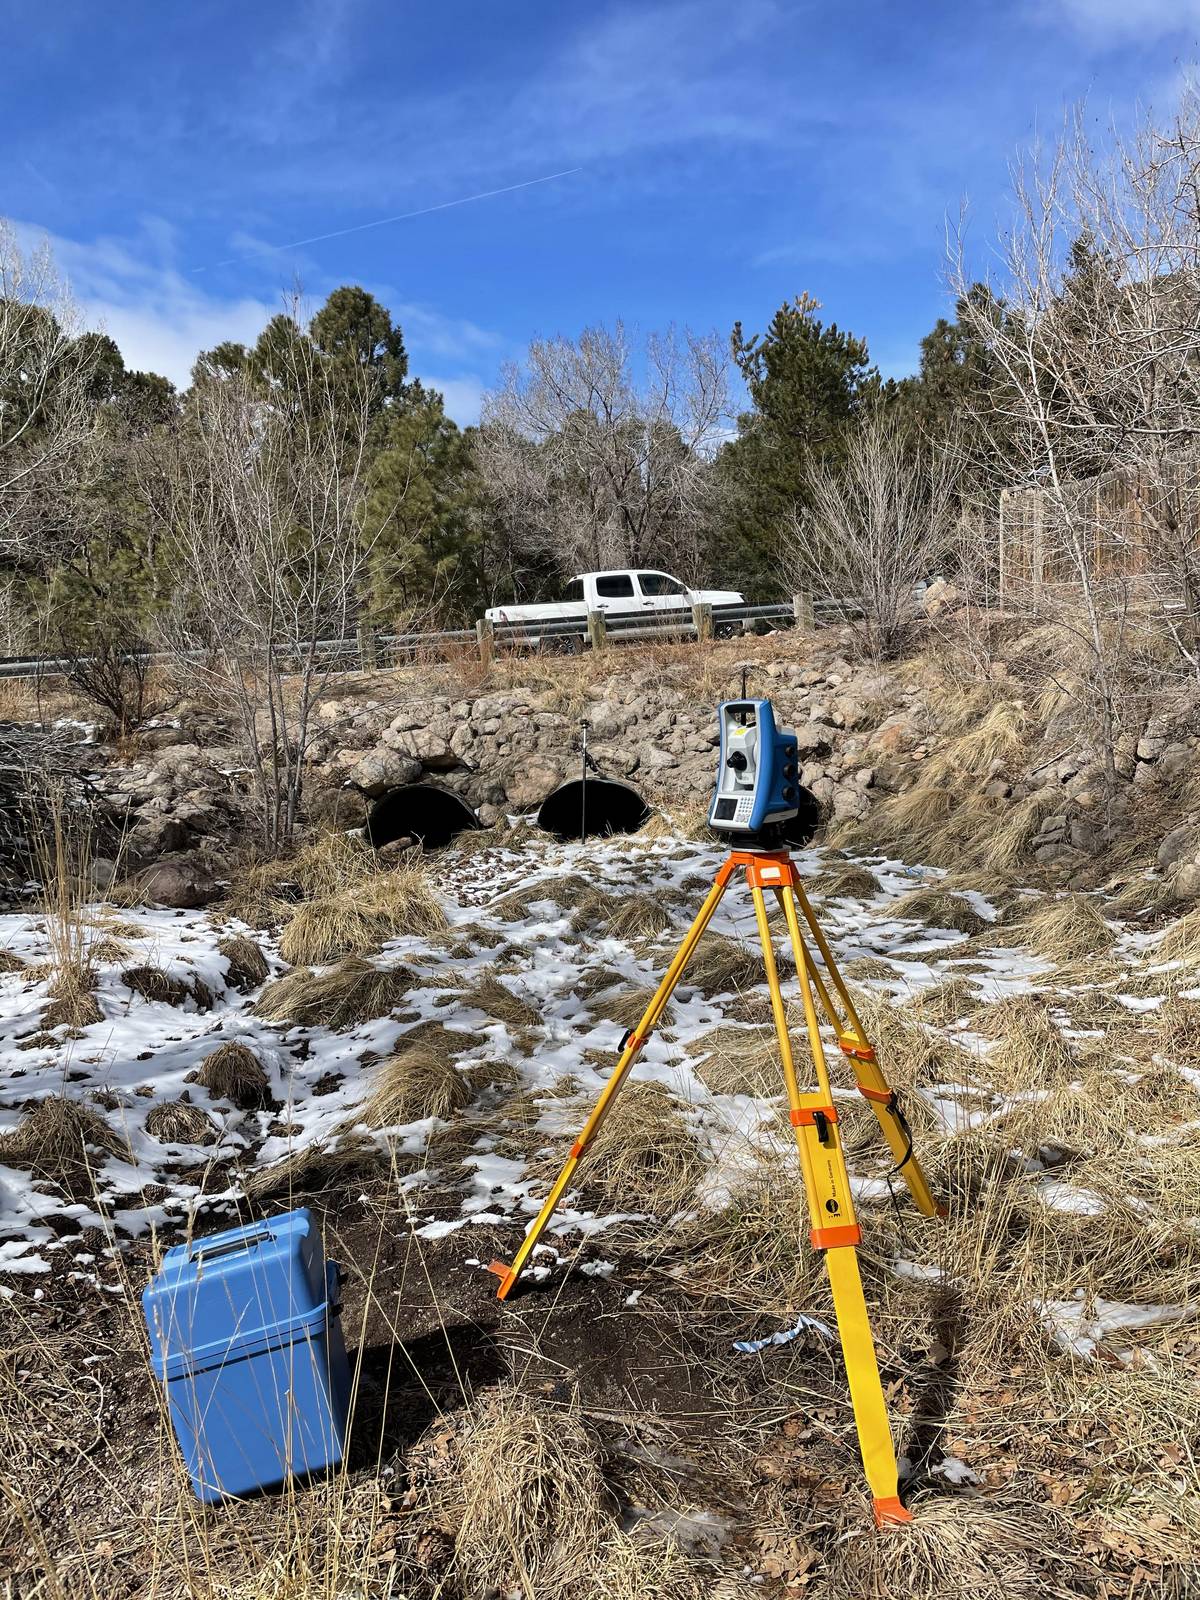
To begin the design process the team first visited the site to establish boundaries for the study. The team decided to survey approximately 150 feet upstream and downstream of the culverts underneath Steves Boulevard. Through land surveying using a GPS and robotic total station roadway characteristics, upstream and downstream channel characteristics, and culvert invert and inlet elevations were determined. Then through field mapping a topographic map was developed which was used to develop cross sections for future modeling. 
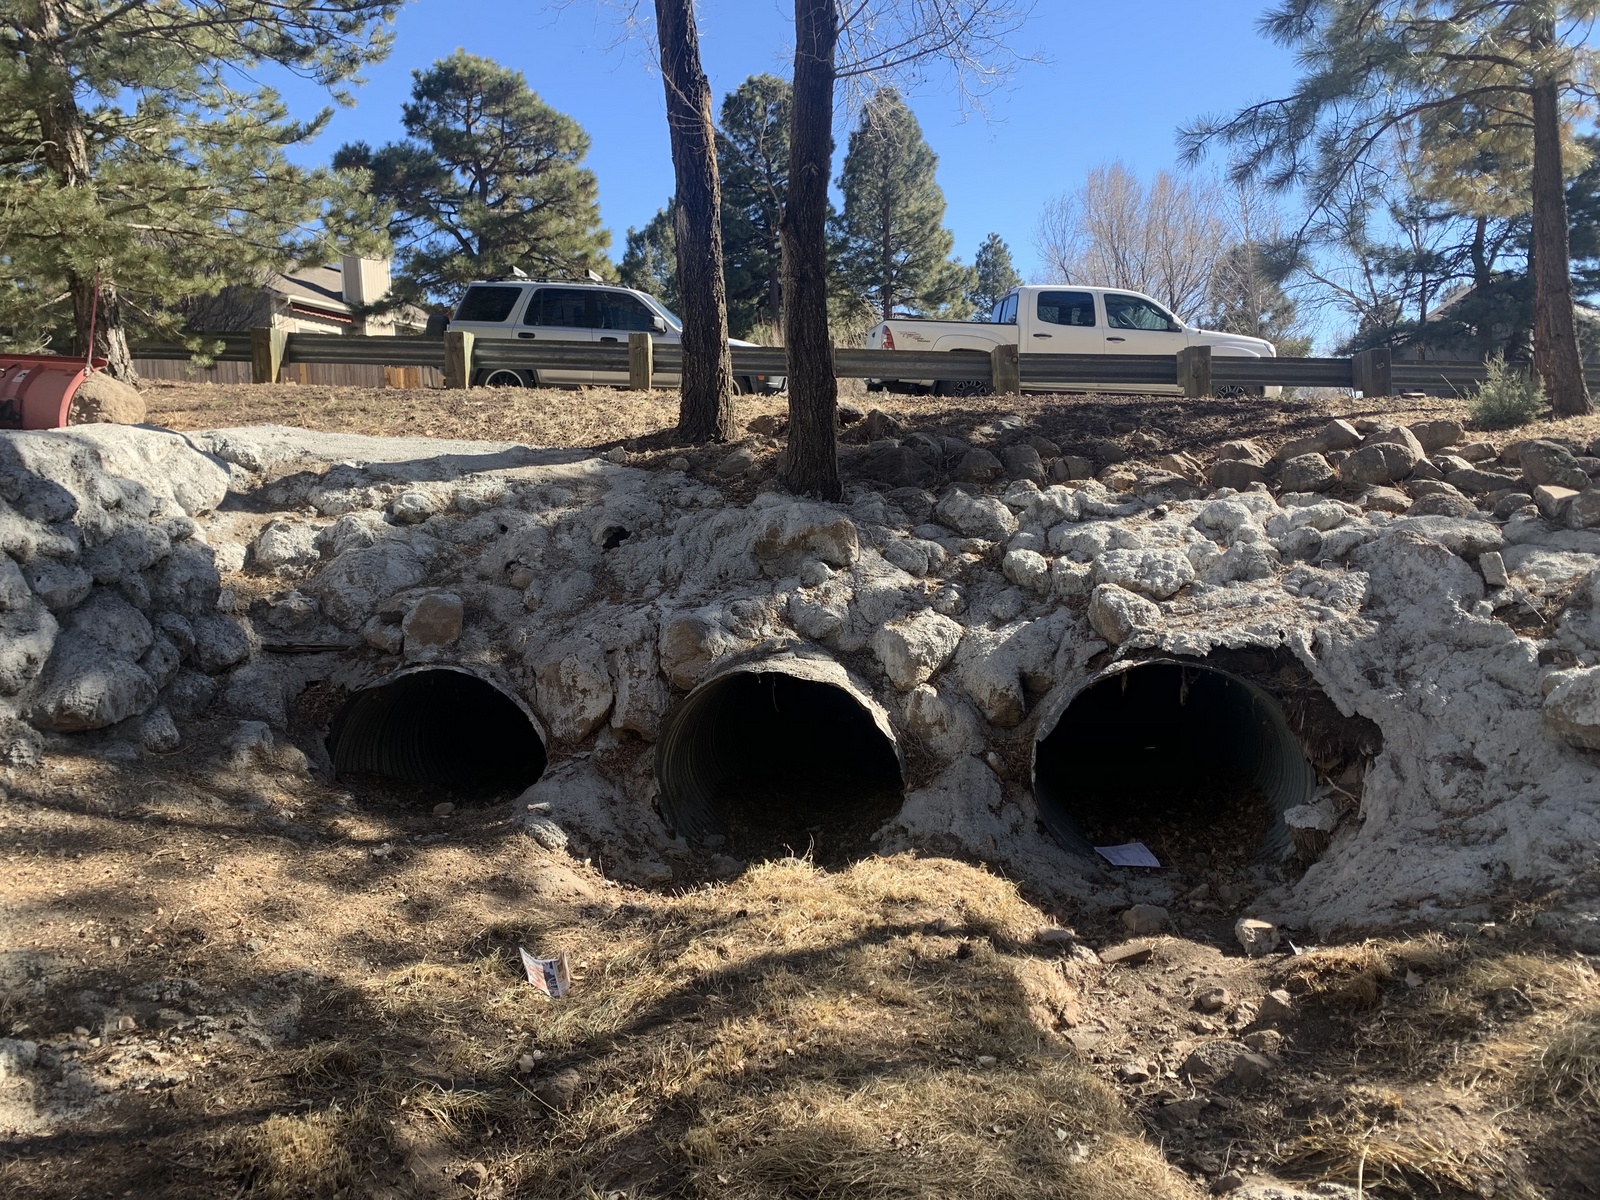
Existing Downstream Culvert Conditions Photo Credits: D'Randa Hooks

Existing Upstream Culvert Conditions Photo Credits: D'Randa Hooks
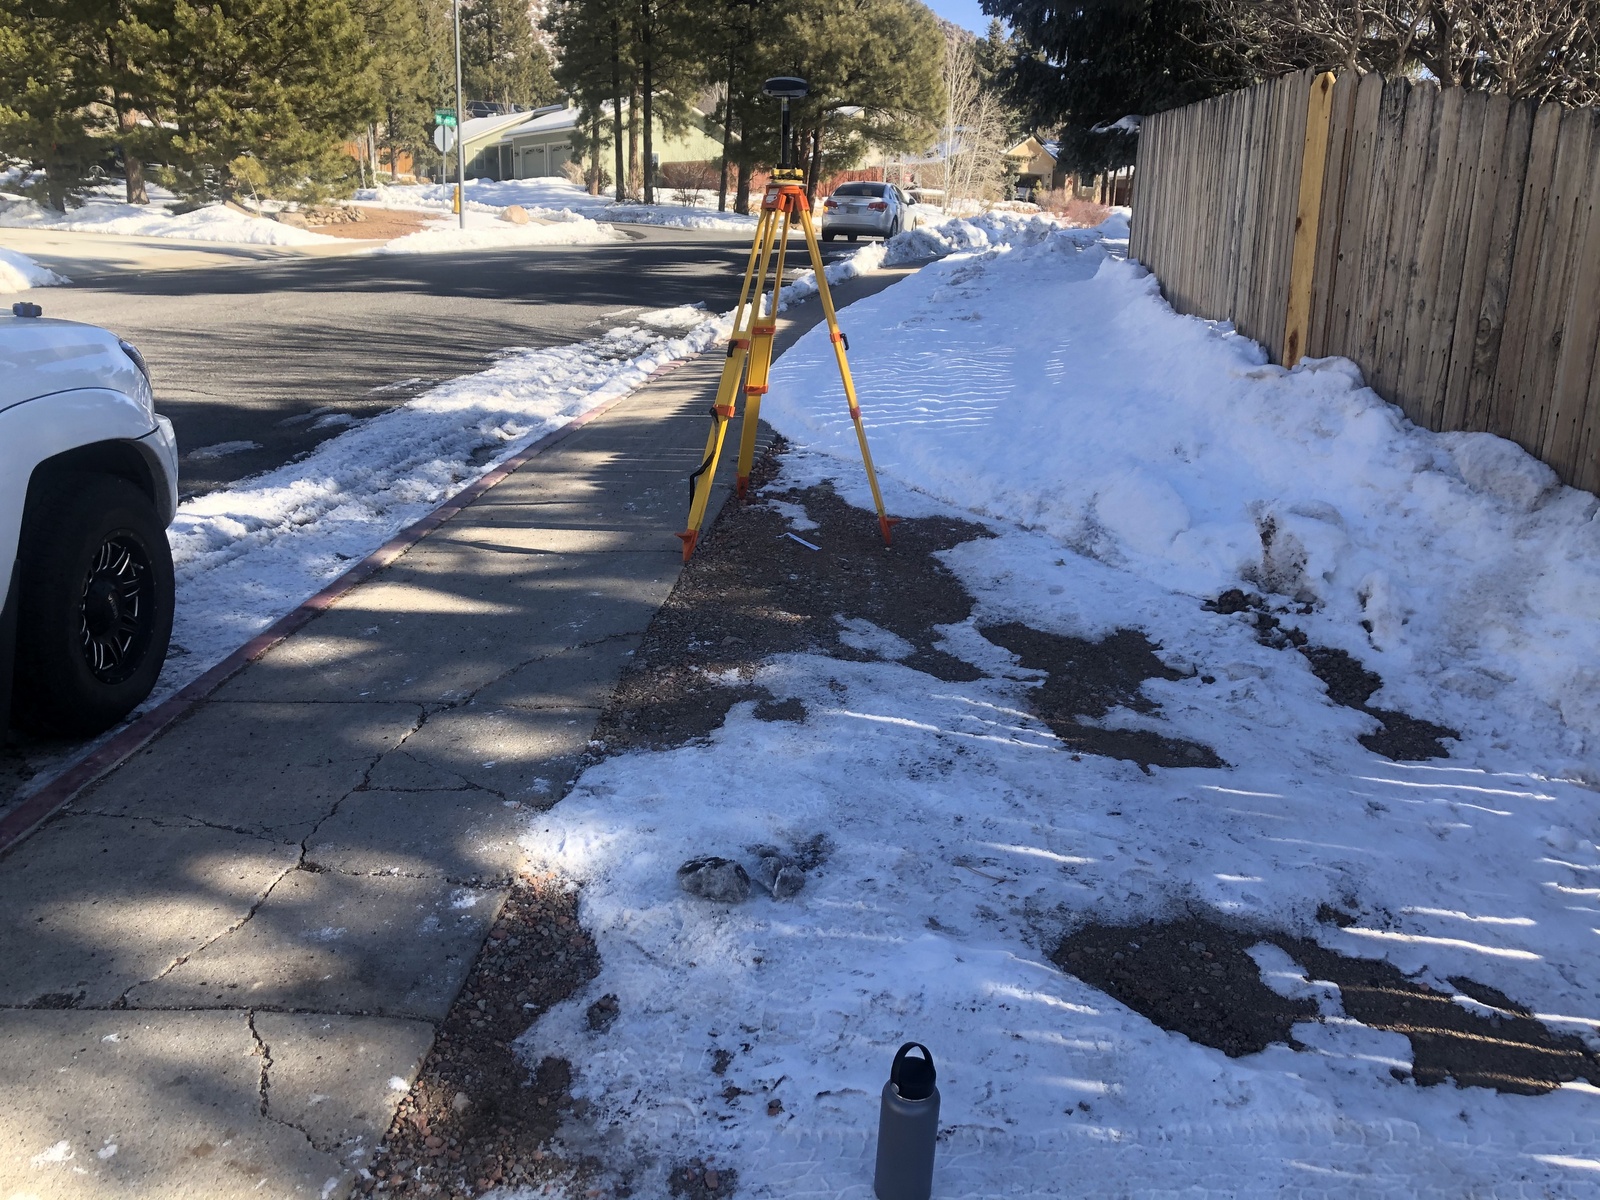
GPS Land Survey Setup Collecting Roadway Data Photo Credits: D'Randa Hooks

Robotic Total Statation Land Survey Setup Collecting Channel and Culvert Data                                                          Photo Credits: Cole Kelley

BACK TO TOP
Hydrologic Analysis 

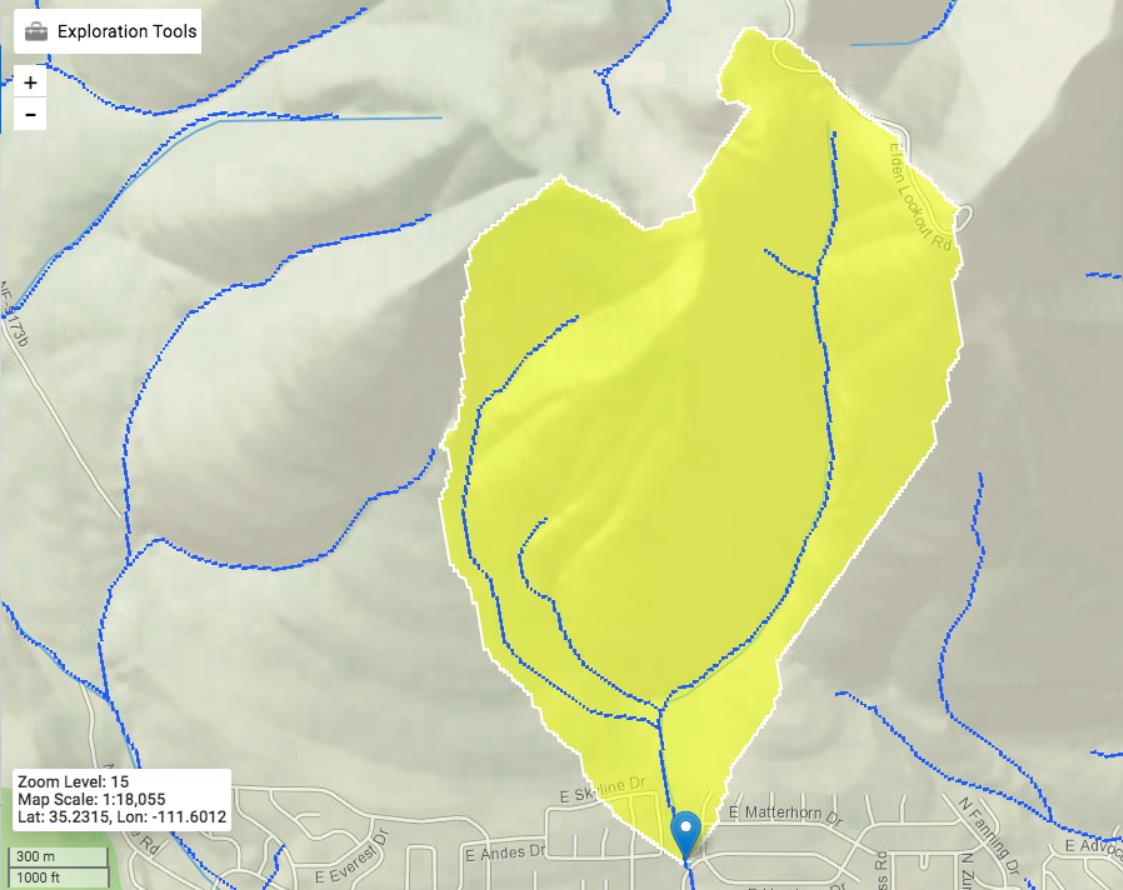
From the site investigation information a hydrologic analysis was conducted to where the watershed area was determined to specify important hydrologic parameters. Specific parameters that were determined were time of concentration, weighted C values, sub-basin storage, deisgn storm precipitation intensities and natural runoff for various storm events. The most important parameter that was used throughout the modeling process was the runoff values for the 50 year storm event (design storm) and the 100 year storm event (check storm) which was determined from the Flagstaff Flood Insurance Study to be 238 and 307 cfs for the two storm events. Other values for hydrologic parameters can be found in the final design report icon on the documents page.  

Watershed Area for the Fanning Wash at Steves Blvd Photo Credits: USGS StreamStats

BACK TO TOP

Hydraulic Analysis

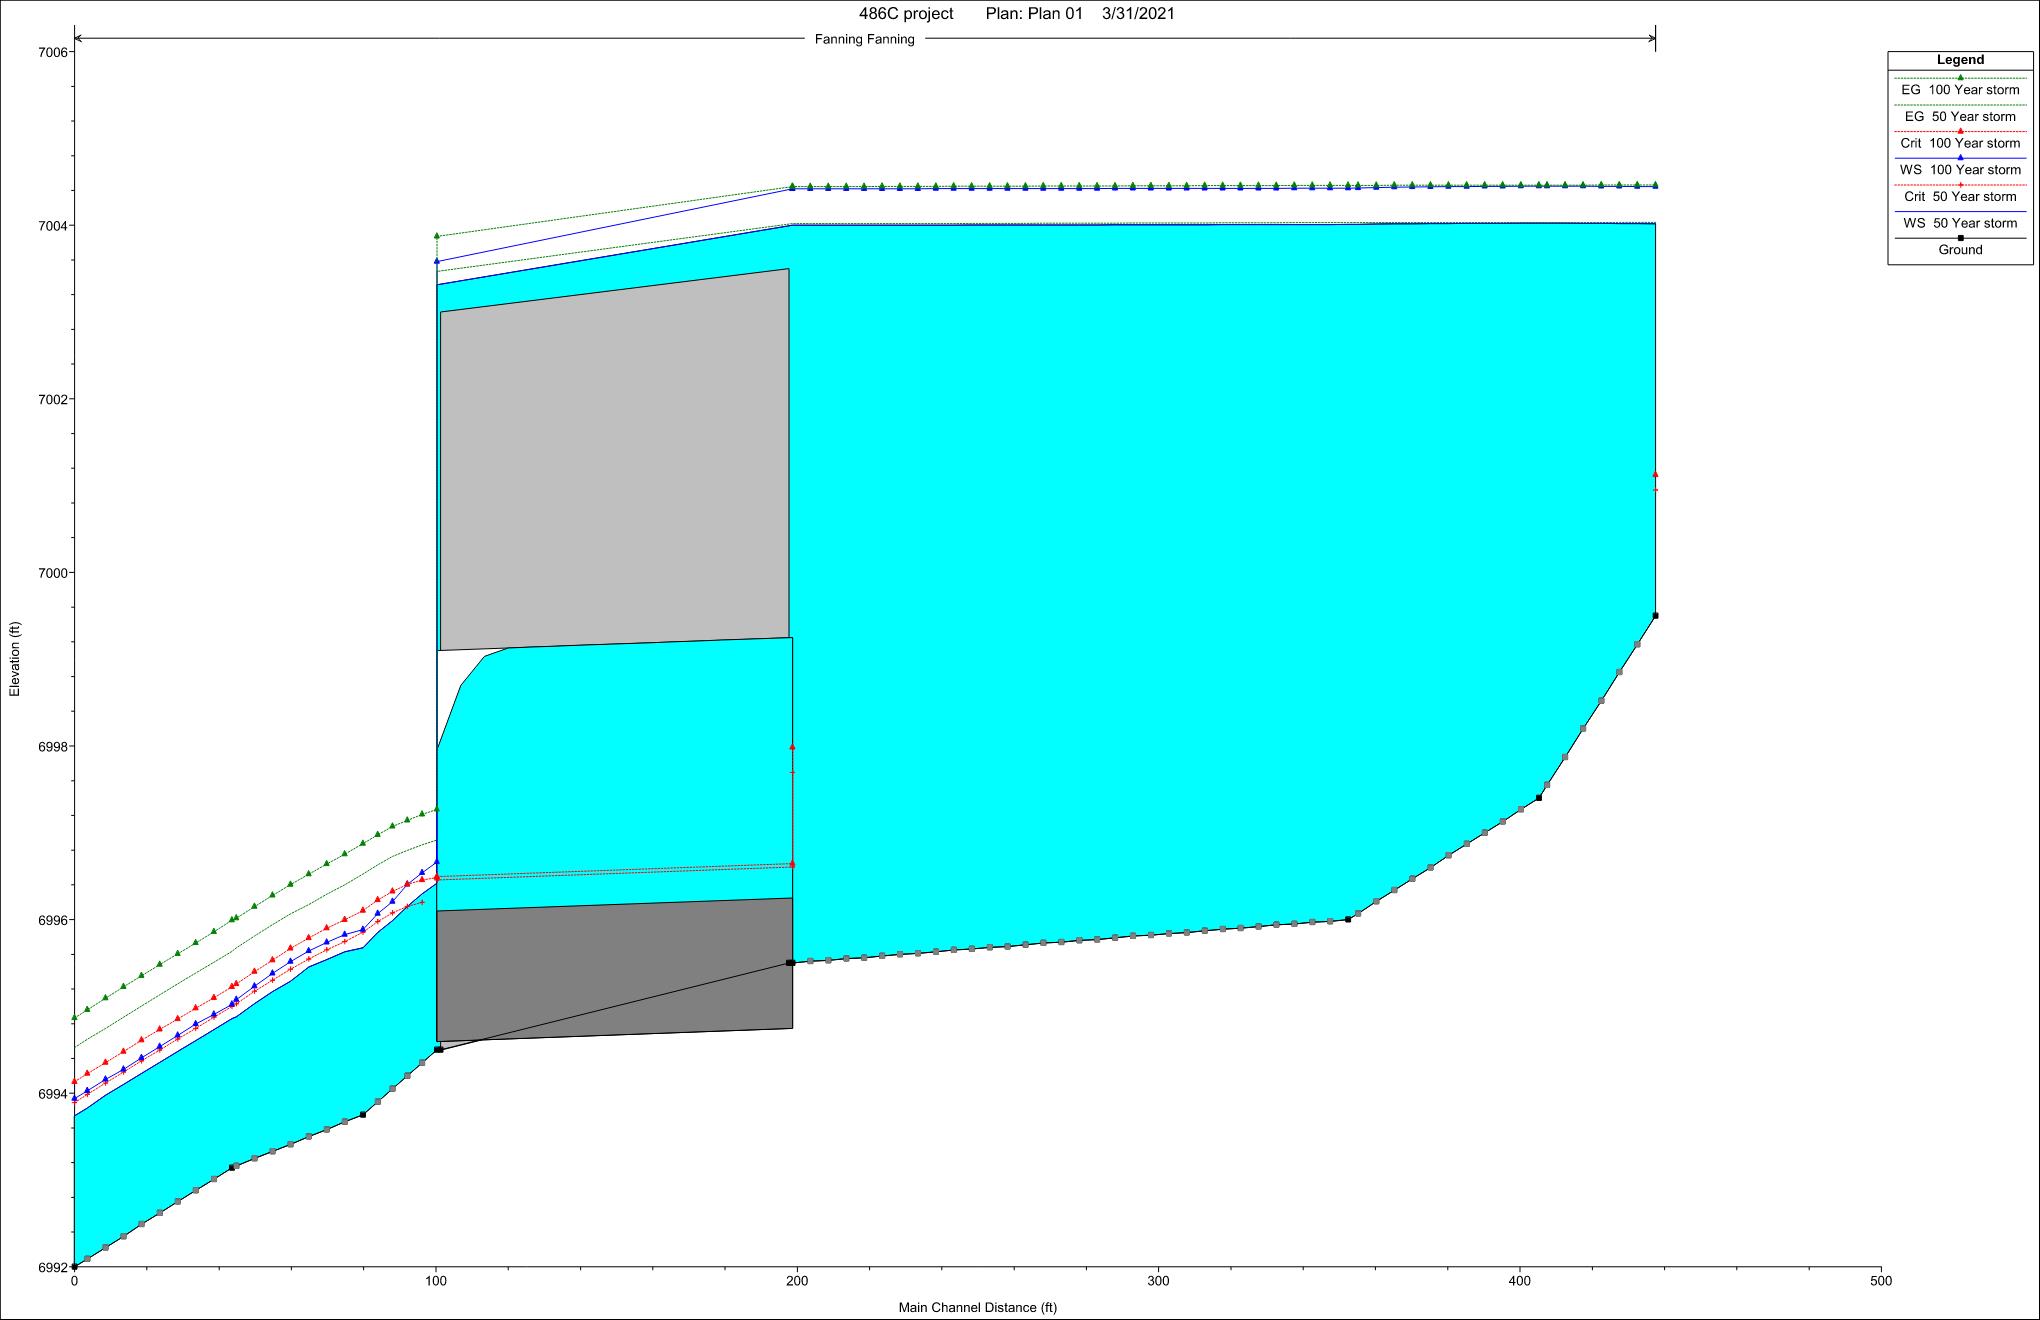
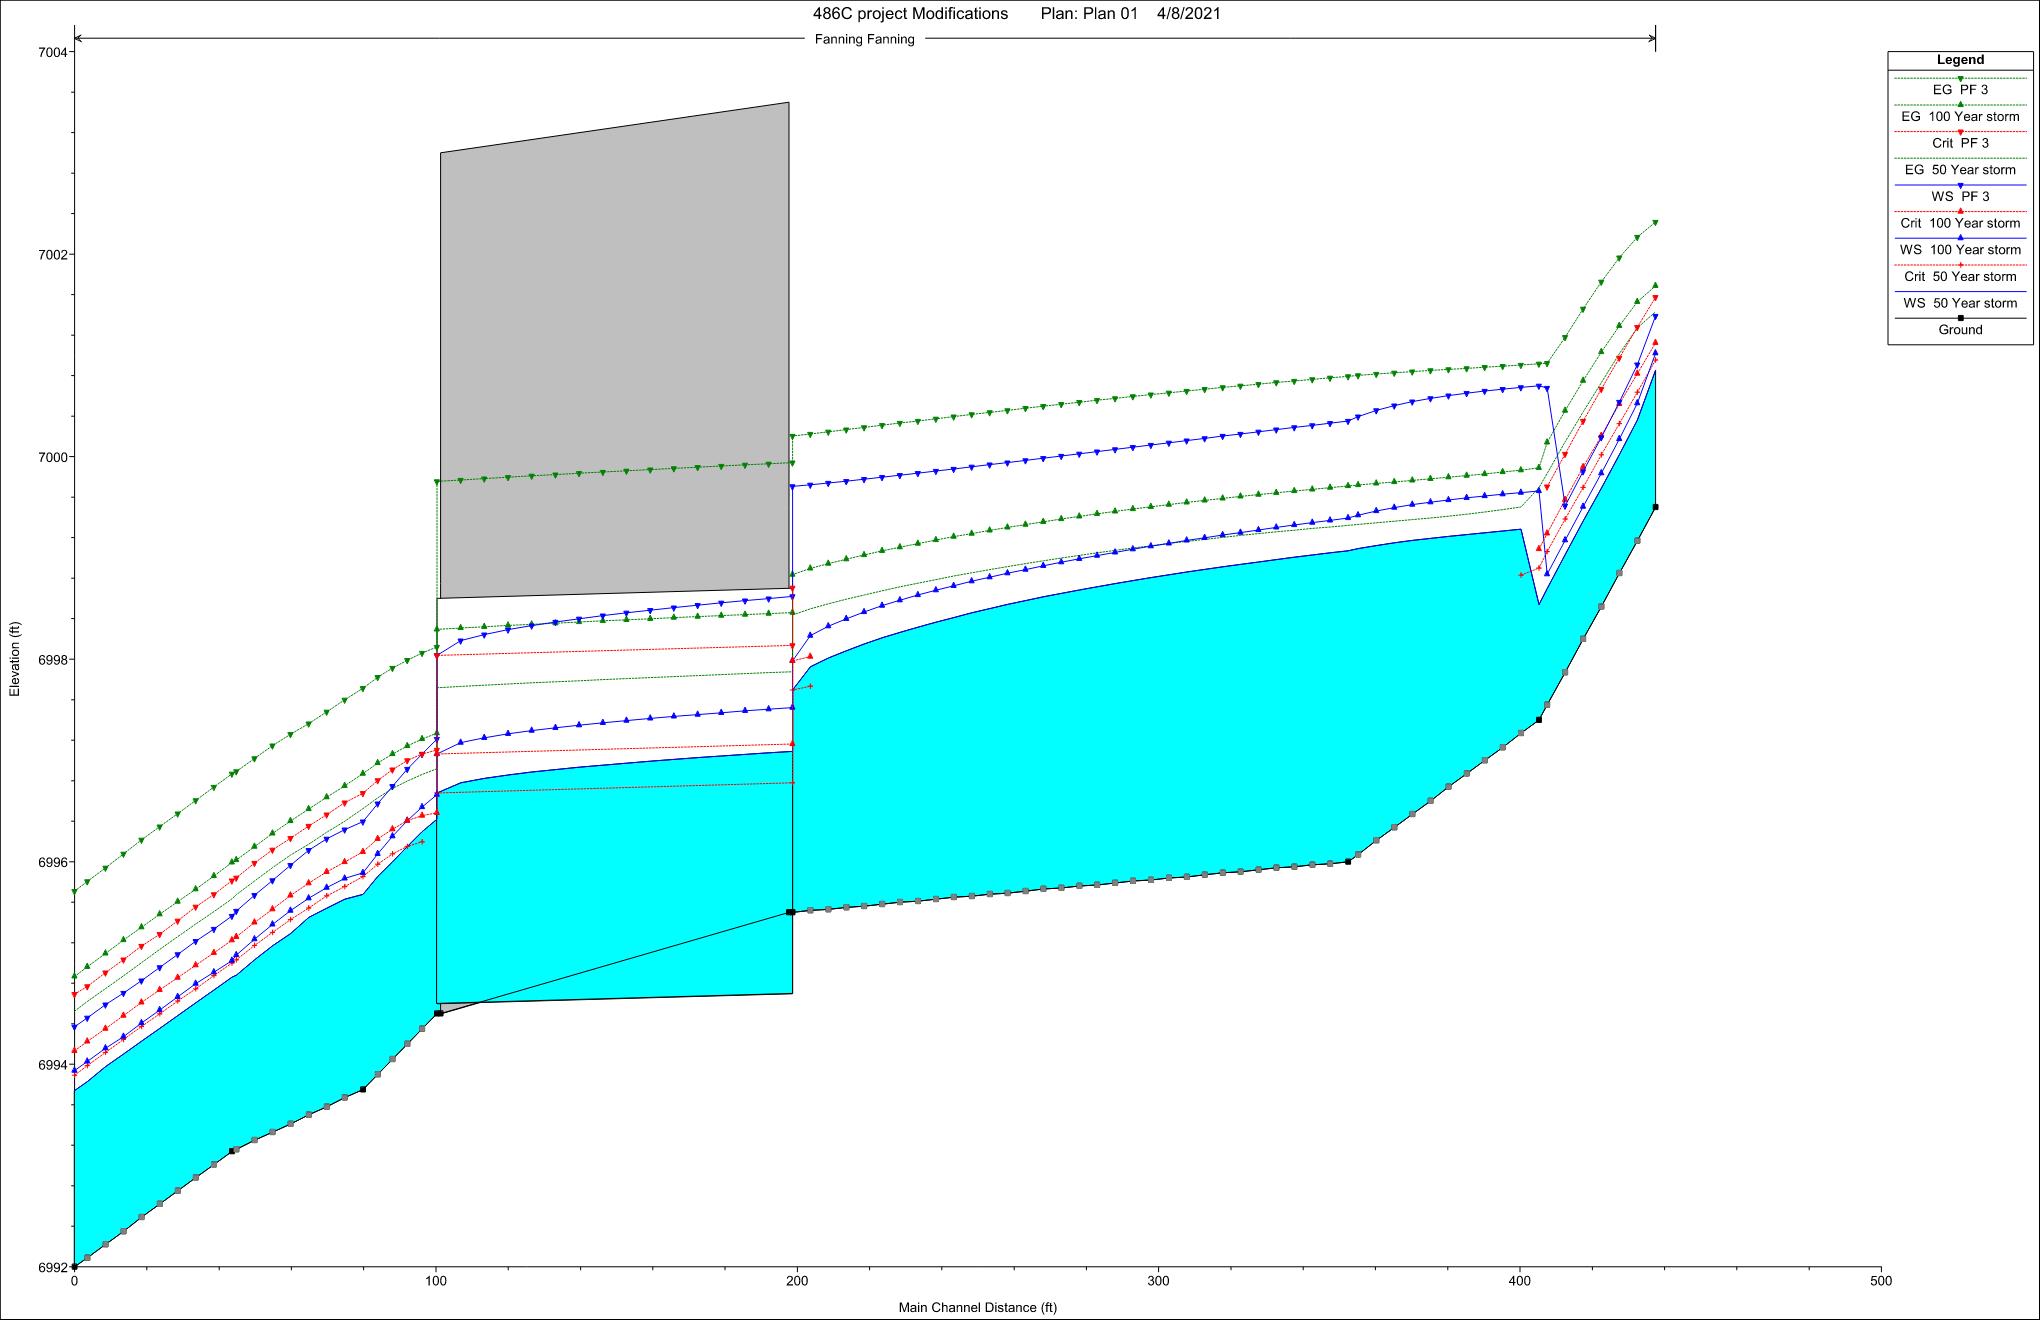
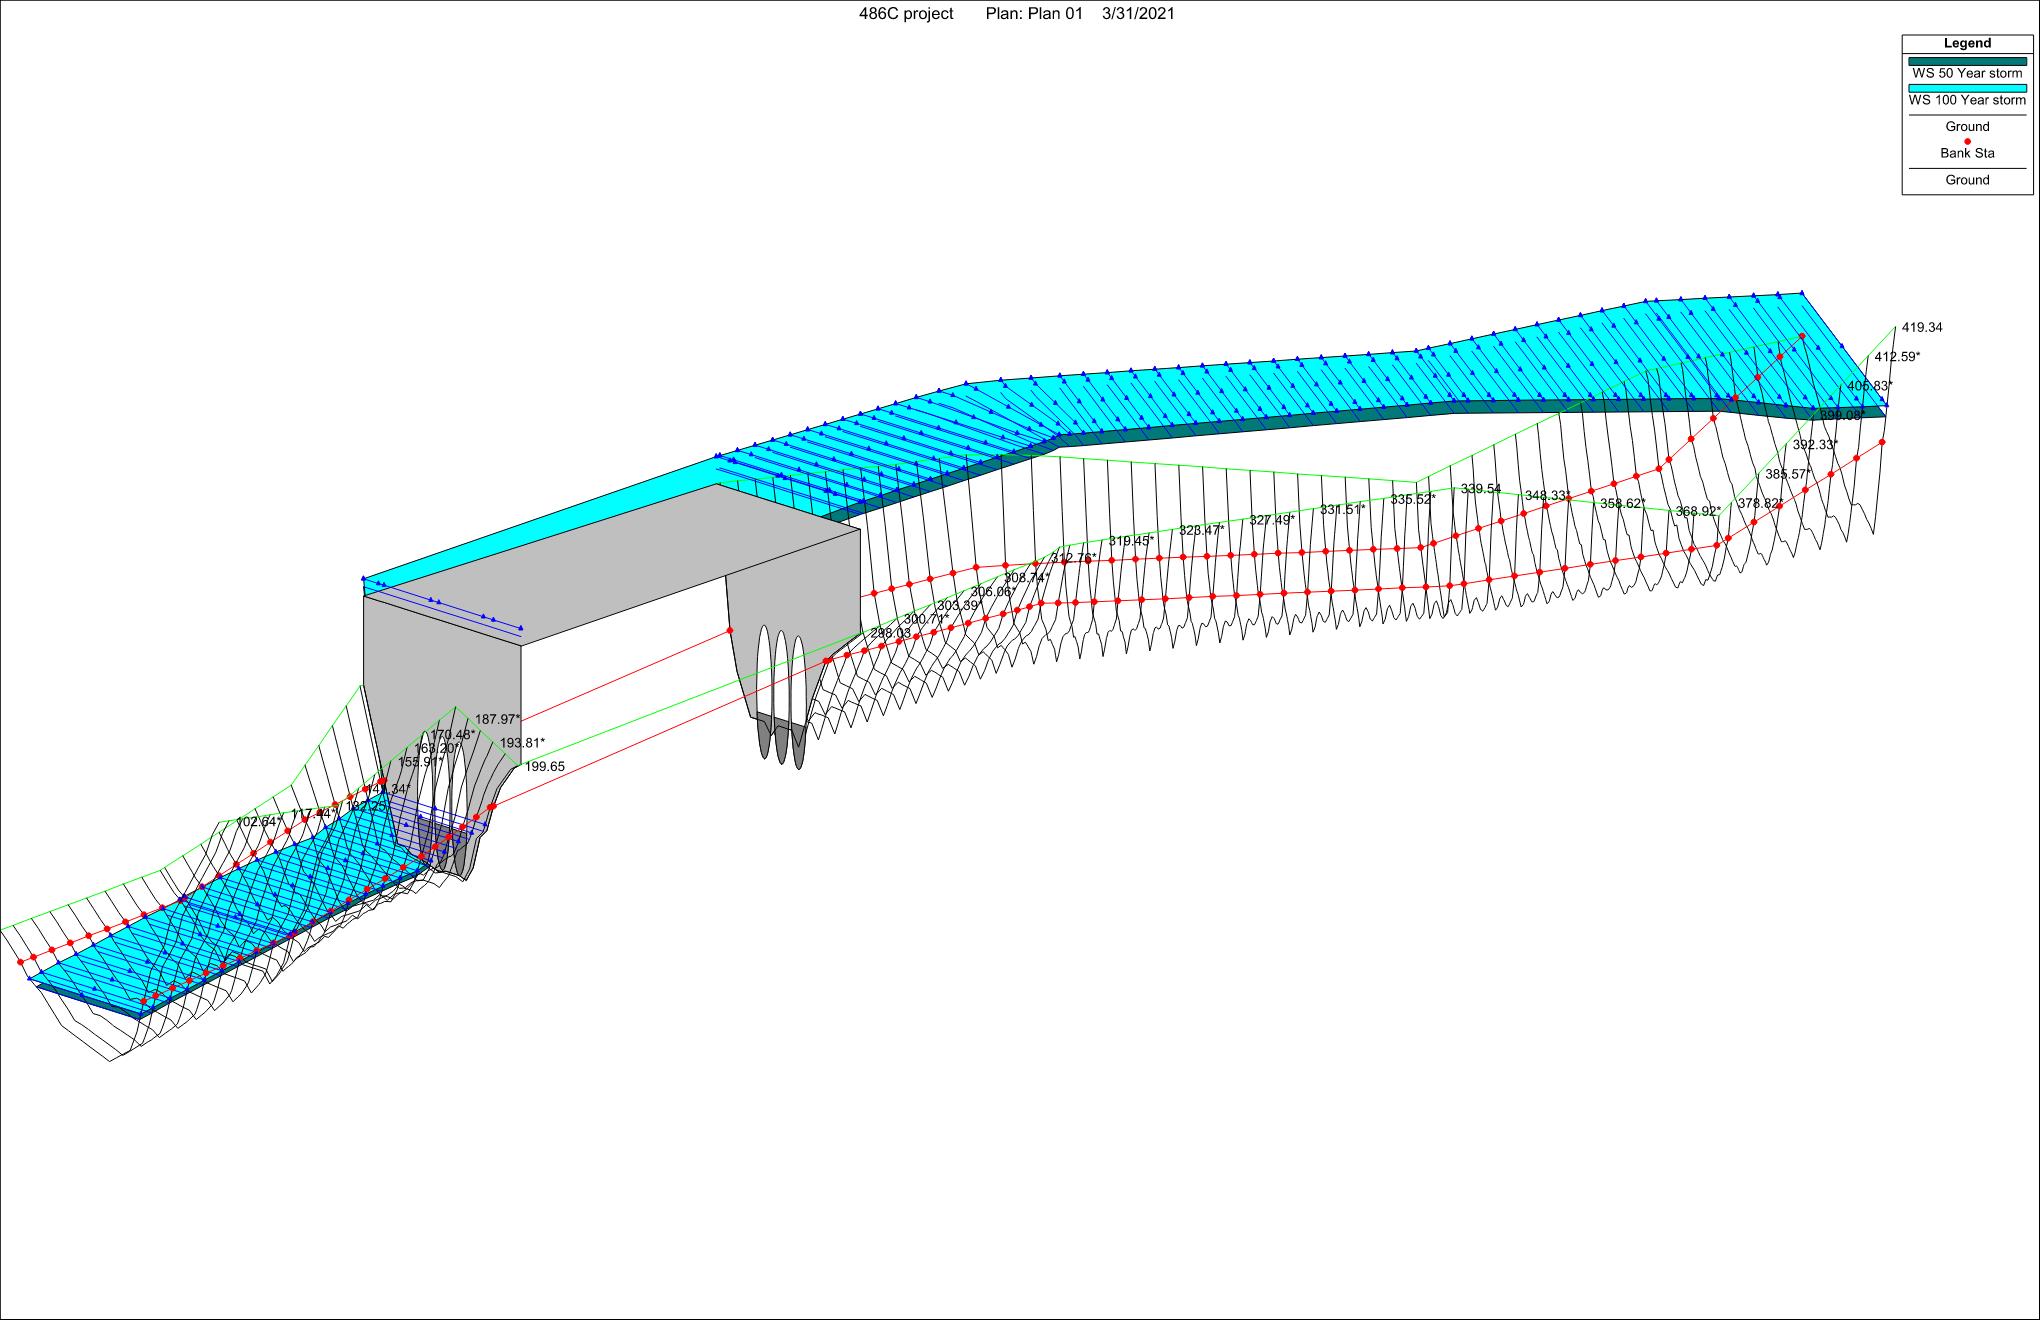
To model the channel and culvert conditions models were produced in Bentley FlowMaster to model the channel conditions, and Bentley CulvertMaster was used to model culvert conditions. To combine these two models HEC-RAS was used to model existing channel and culvert conditions as well as the proposed design. As shown in the images below the existing channel and culverts have the potential for overtopping when the 100 year storm event was modeled. Through analysis a 7 foot by 4 foot double barrel concrete lined box culvert was modeled in HEC-RAS which from the model and other calculations the new culvert design can convey the 100 year storm event and will be depicted below. 

Existing Culvert and Channel Conditions HEC-RAS Model showing Overtopping

Existing Culvert and Channel Profile in HEC-RAS  showing Overtopping

BACK TO TOP

Design Alternatives

From the two tables depicted below a total of seven different design solutions were considered for implementation to be able to pass the 100 year storm event. As the first table below shows that a variety of arched, box, corrugated metal pipes, and concrete culverts were considered to improve drainage condtions at the site. These various proposed solutions were then modeled in Bentley CulvertMaster and HEC-RAS to be able to determine the best culvert type that meets all of the City of Flagstaff requirements. The potential solutions considered were then put through our decision matrix to determine which produced the most desirable conditions. Per the City of Flagstaff requirements, the flow should be subcritical, unpressurized, and operate under inlet control. The minimum diameter of the culvert must be greater than 18 inches, and there must be a minimum of at least 1 foot of freeboard. While velocity is not a requirement per the City of Flagstaff (besides having to be less than 20 ft/s), we chose to limit our velocity to greater than 4 feet per second and less than 10 feet per second to ensure self cleansing and negate the need for any energy dissipators. Each item was valued equally besides the velocity, which was assigned half the points as it is only a design goal rather than a criteria. Each criteria was simply assigned all or no points based on whether the criteria was met. Highlighted in green below, potential solution S6 was identified as the most desirable option  

Proposed Designs Table 

Decision Matrix to Determine Proposed Design

BACK TO TOP

Final Proposed Design

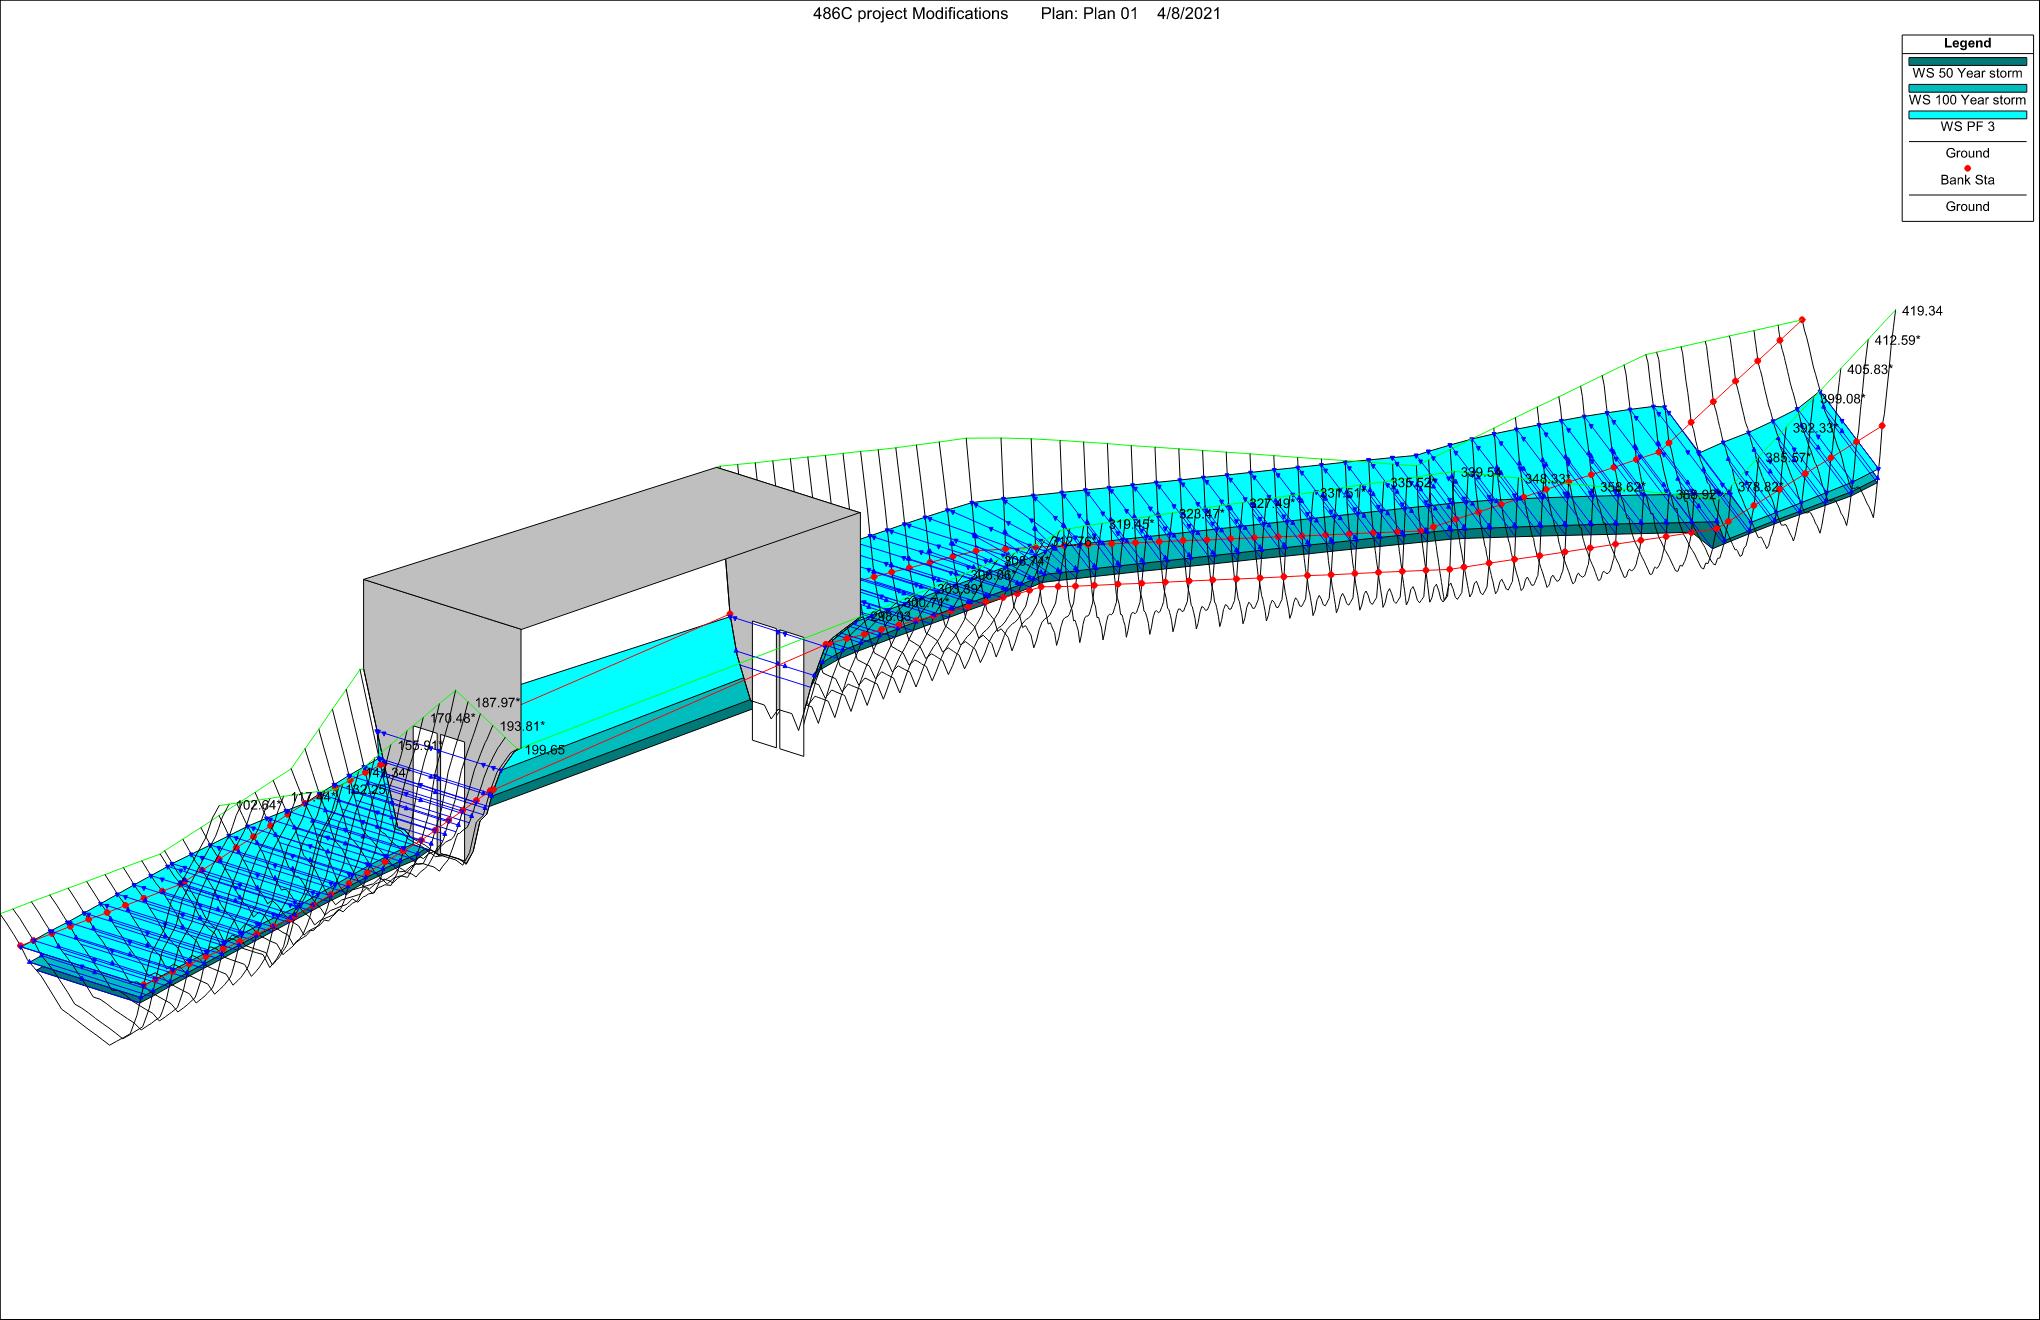
From the analysis above the final proposed design was solution S6 which was two 7 foot by 4 foot premanufactured box culvert to help improve drainage conditions and be able to pass the 100 year storm event. As the HEC-RAS models show below they improve the channel and culvert conditions not allowing water to overtop the channel and enter the floodplain, as well as not allowing the water to overtop the roadway. Through analysis this was the best culvert design to improve culvert and channel conditions at the intersection of the Fanning Wash and Steves Blvd. Since this is the most upstream drainage infrastructure this design required a larger inlet structure to prevent large debris and sediment from clogging the inlet of the culvert. Further analysis of why this design was implemented can be found in the design report in the document section.   

Proposed Culvert and Channel Conditions HEC-RAS Model 

Proposed Culvert and Channel Profile from HEC-RAS 

BACK TO TOP

Construction Plans

Through the design process construction plans were developed where a topographic map (depicted below) was produced for the project area at the intersection of Steves Boulevard and the Fanning Wash. A full construction plan set was produced with a floodplain map, channel cross sections, cover page, notes, details, and a plan view of the proposed double barrel box culvert location. Additional construction plans can be found in the documents tab by clicking on the plan set icon. 

BACK TO TOP

Cost of Implementation

As depicted in the table below the total cost to implement the proposed design was estimated by the design team to be slightly over 166,000 dollars. The proposed design cost was estimated using different schedules provided to the team. See the design report for a full breakdown and analysis of the cost of implementation. 

BACK TO TOP