General project information can be found here. This page includes details about the scope of services and project tasks, the scheduling, staffing, and the total cost of the project.
A-maize Cob-oration continued the research of last year's Corn Cob Biosorbent Research. Their Cadmium results included an average removal efficiency of 76% using an untreated (without activation) corn cob biosorbent, 97% removal efficiency using a treated (with nitric acid activation) biosorbent, in addition they developed a prototype. This year, A-maize Cob-oration was assigned the task of expanding on the Cadmium removal using nitric acid activated corn cob as a biosorbent, in addition to testing the removal efficiency of corn cob in the removal of Arsenic and Total Coliform. This project was inspired by the Gold King's Mine Spill in Colorado in 2015.
Due to the nature of the project, there were multiple identified constraints. All work completed for the project was done in a lab setting under a fume hood. With this, exposure from outside contaminants is very low, making the project limited to possible contamination as would be found in a real-world implementation. For a field application of this research, the limitations of lab testing will be apparent, as there will be additional external influences and contamination. An additional constraint of this project was the detection limit of the XRF device, which was used to determine the levels of Arsenic in corn after batch reactions. The detection limits were too high for the concentrations tested in the research project.
The major tasks from this project are as follows:
Task 1.0 - Weak Acid Decision Matrix
Task 2.0 - XRF Testing Method Development
Task 3.0 - Biosorbent Preparation
Task 4.0 - Testing of Contaminants
Task 5.0 - Analysis
Task 6.0 - Project Impacts
Task 7.0 - Project Deliverables
Task 8.0 - Project Management
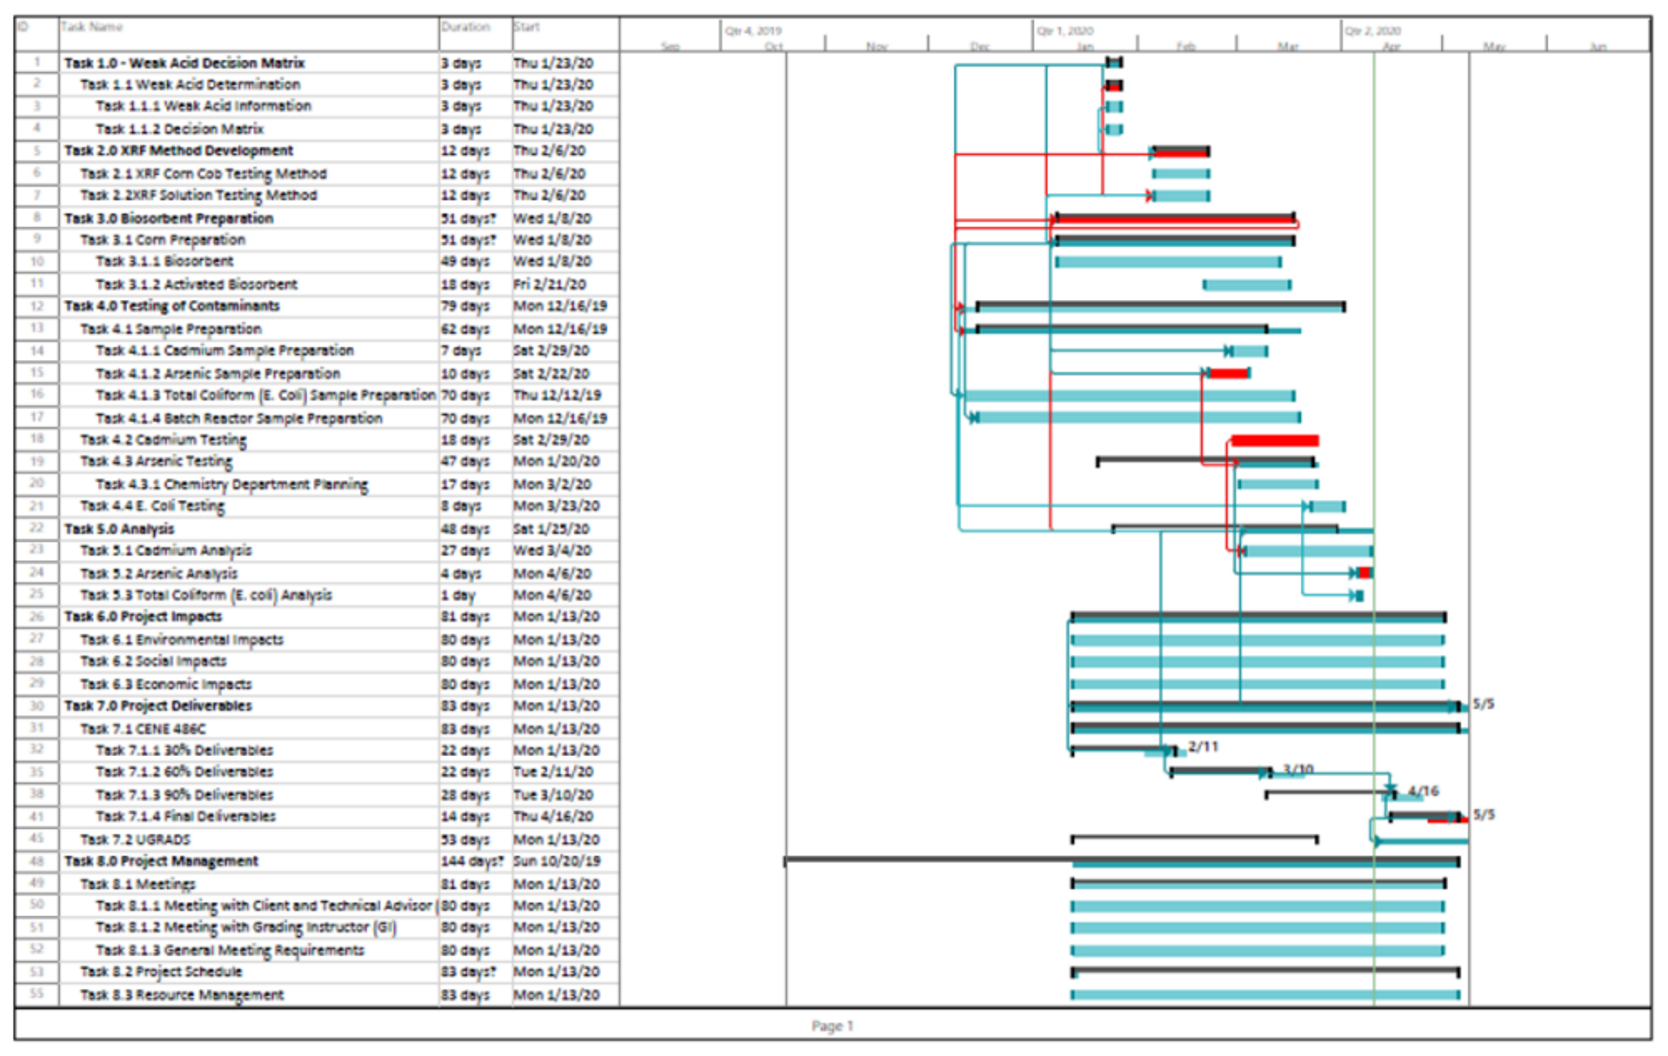
Additional information on each of these tasks and their sub-tasks can be seen on the schedule below.
The scheduling plan and Gantt chart used for this project can be seen below. All the tasks were designed to be start-to-start (SS). The critical path is highlighted in red. Please note that this is the updated Gantt chart that is true to all start and end dates for each task. The original Gantt chart, along with a discussion of all schedule setbacks and accelerations, are located in the Final Report found under the Documents tab.
Gantt Chart

Staffing Plan
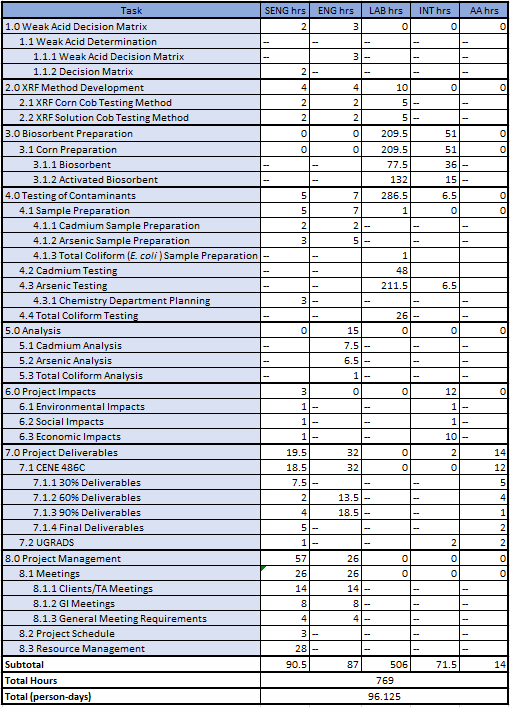
The staffing plan for each task and subtask can be seen below, along with the total number of hours put in by each team member. Please note that this table represents the true number of hours put into this project, the personnel hour estimate can be found in the Final Report under the Documents tab.
Personnel Hours

Project Cost
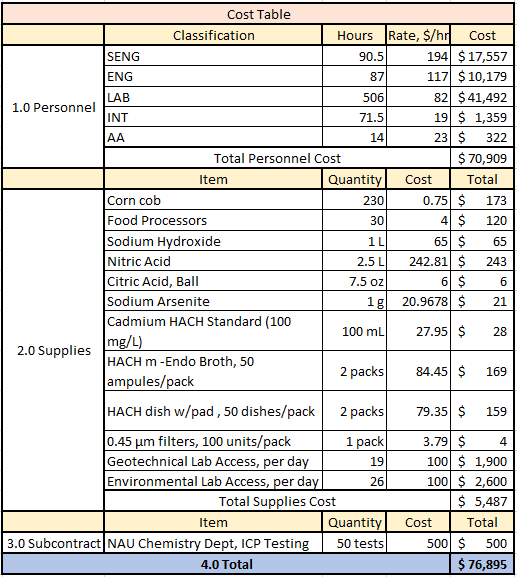
The breakdown and total cost of this project can be found in the following table. Please note that this table represents the true cost of the project, the cost estimate can be found in the Final Report under the Documents tab.
Cost Analysis

Updated: 5 May 2020, 10:00AM
Copyright © 2015 · All Rights Reserved
The staffing plan for each task and subtask can be seen below, along with the total number of hours put in by each team member. Please note that this table represents the true number of hours put into this project, the personnel hour estimate can be found in the Final Report under the Documents tab.
Personnel Hours
The breakdown and total cost of this project can be found in the following table. Please note that this table represents the true cost of the project, the cost estimate can be found in the Final Report under the Documents tab.