The experimental methods and matrices that were utilized in order to complete the project's objectives are described and depicted here. A more in-depth description can be found in the Final Report and Final Presentation.
In order to complete Objective 3 of this research, first a weak acid needed to be selected. A decision matrix was used to choose best fit weak acid. Three weak acids that have been used in published research to active various biosorbents were chosen for the decision matrix: Mercaptoacetic, Citric, and Tartaric. The four criterion for this decision matrix were cost, effectiveness in activating the sorption sites of the biosorbent, ease of use during the activation process, and the level of danger the acid poses on human health. All four of these criterion were equally weighed. The lowest number indicates the best fit acid regarding feasibility and functionality for this research. Citric acid was the chosen weak acid for this study.
Weak Acid Decision Matrix
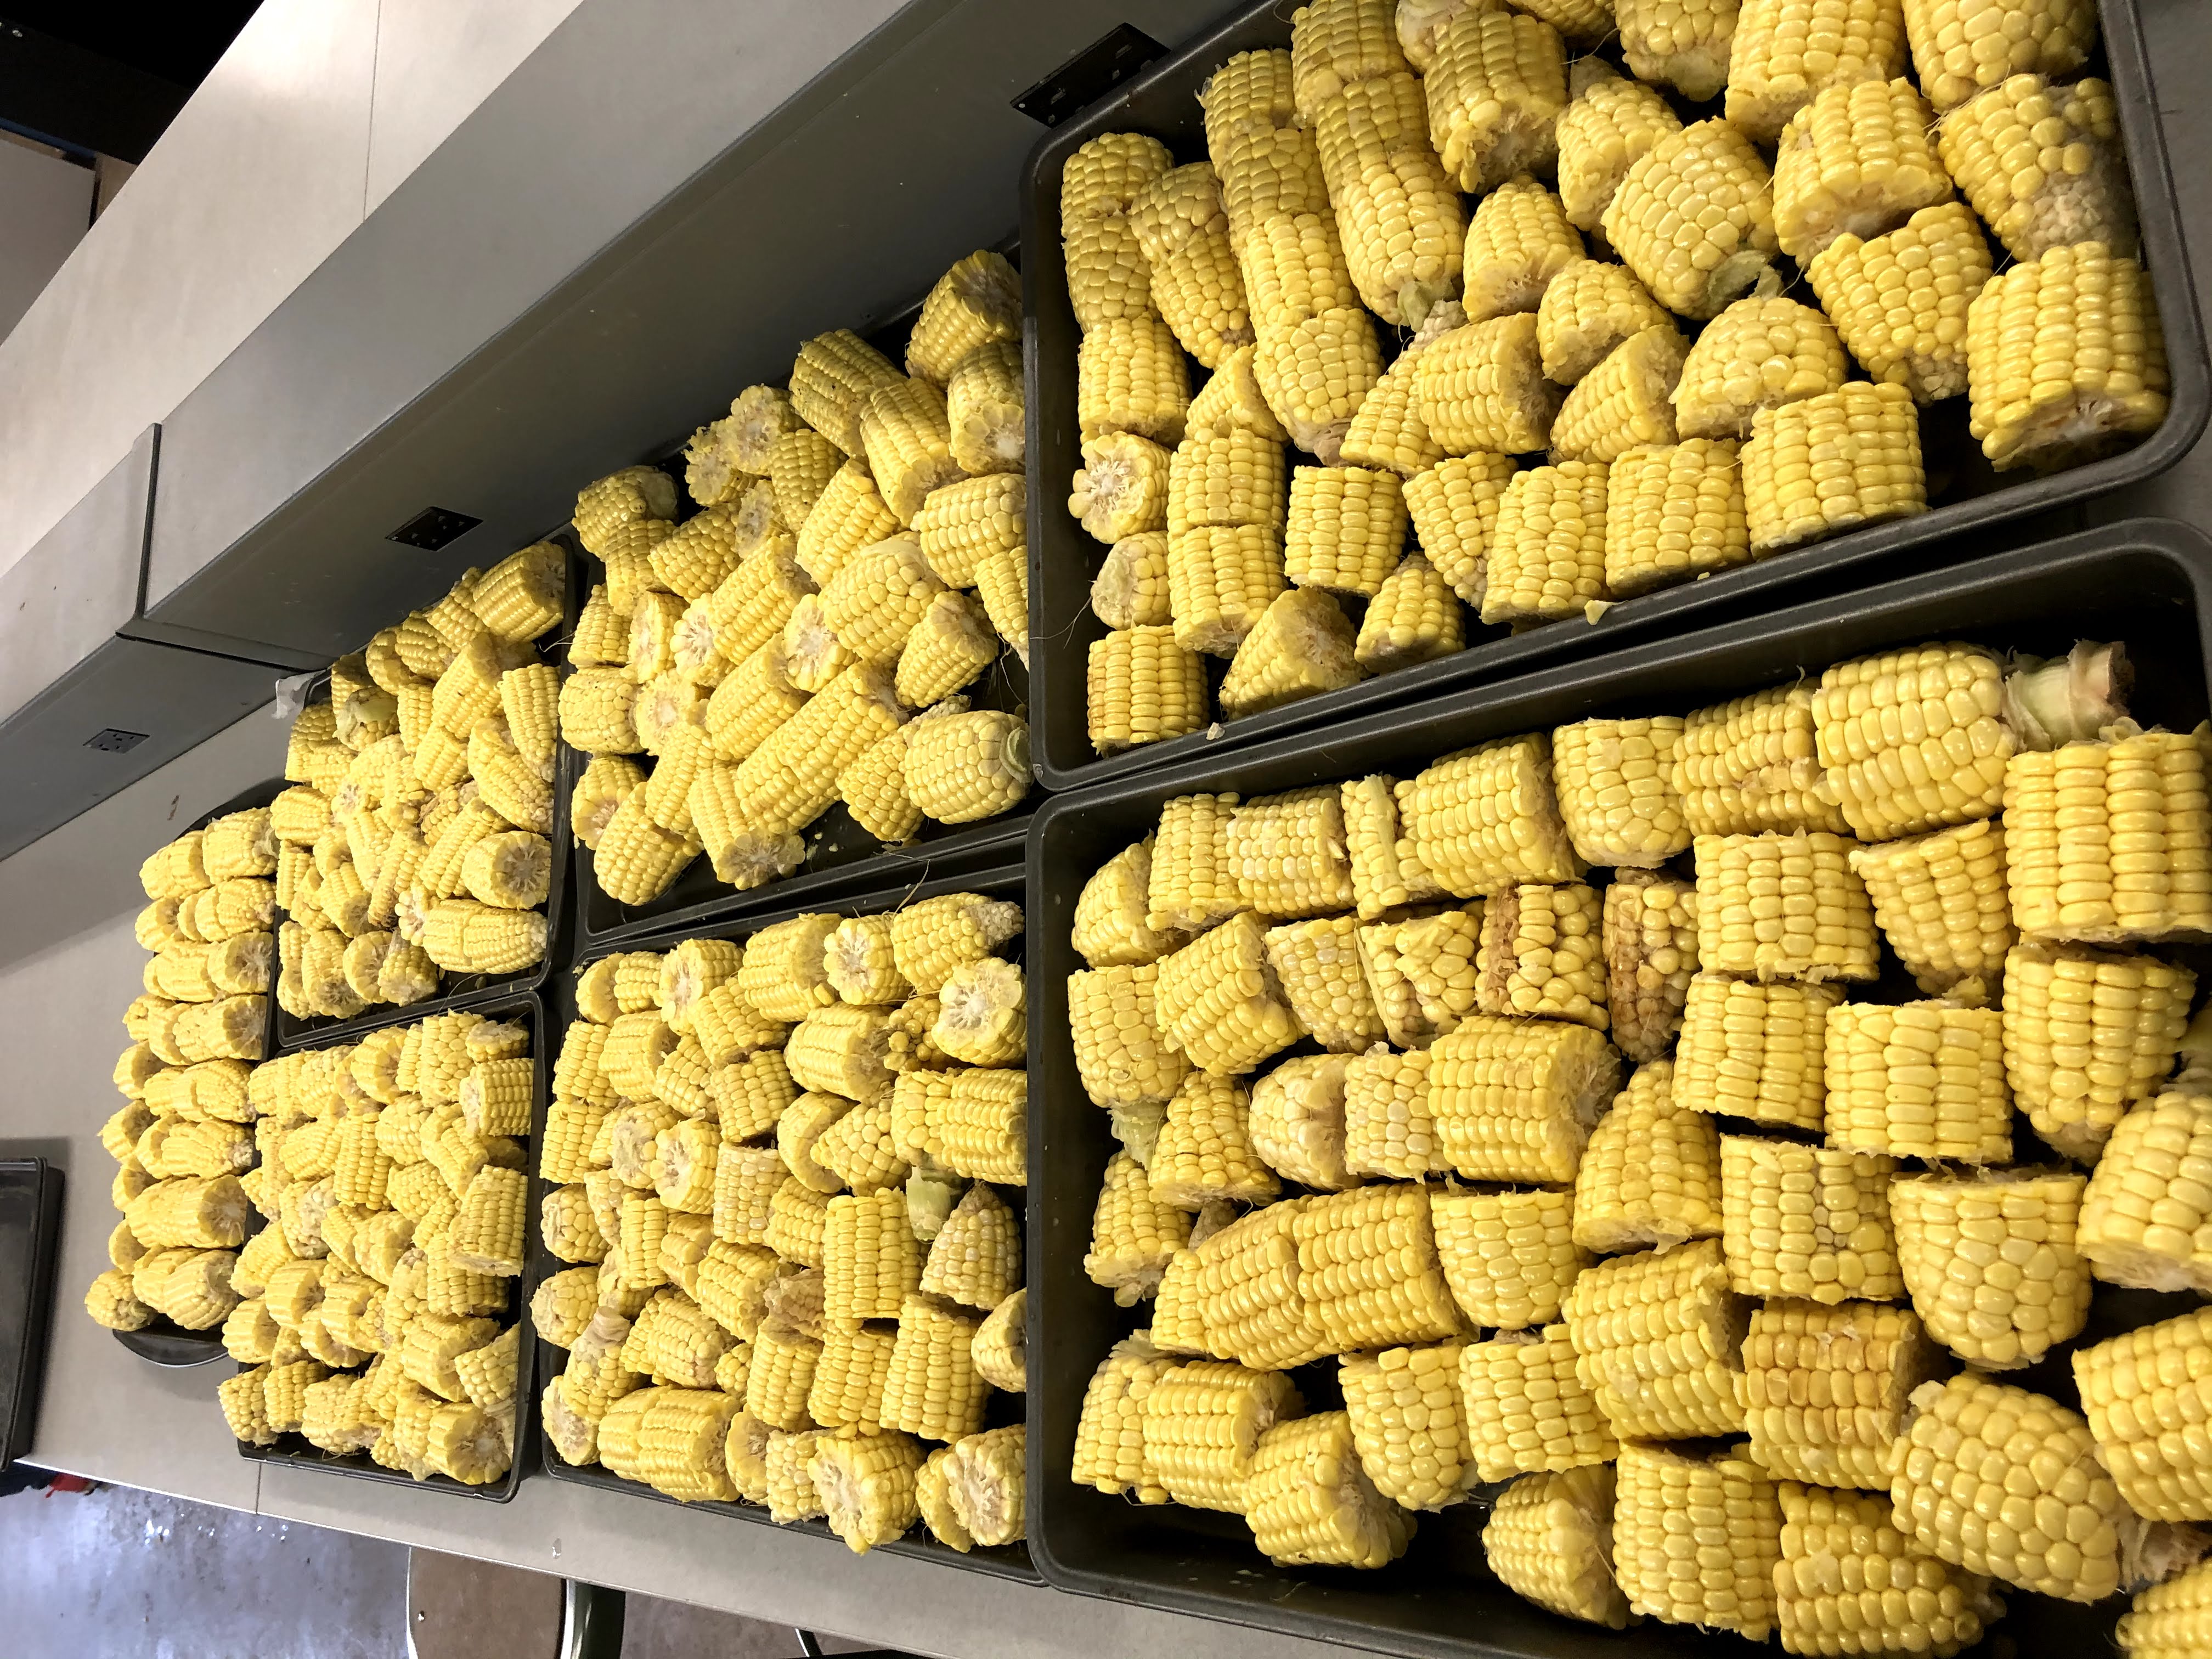
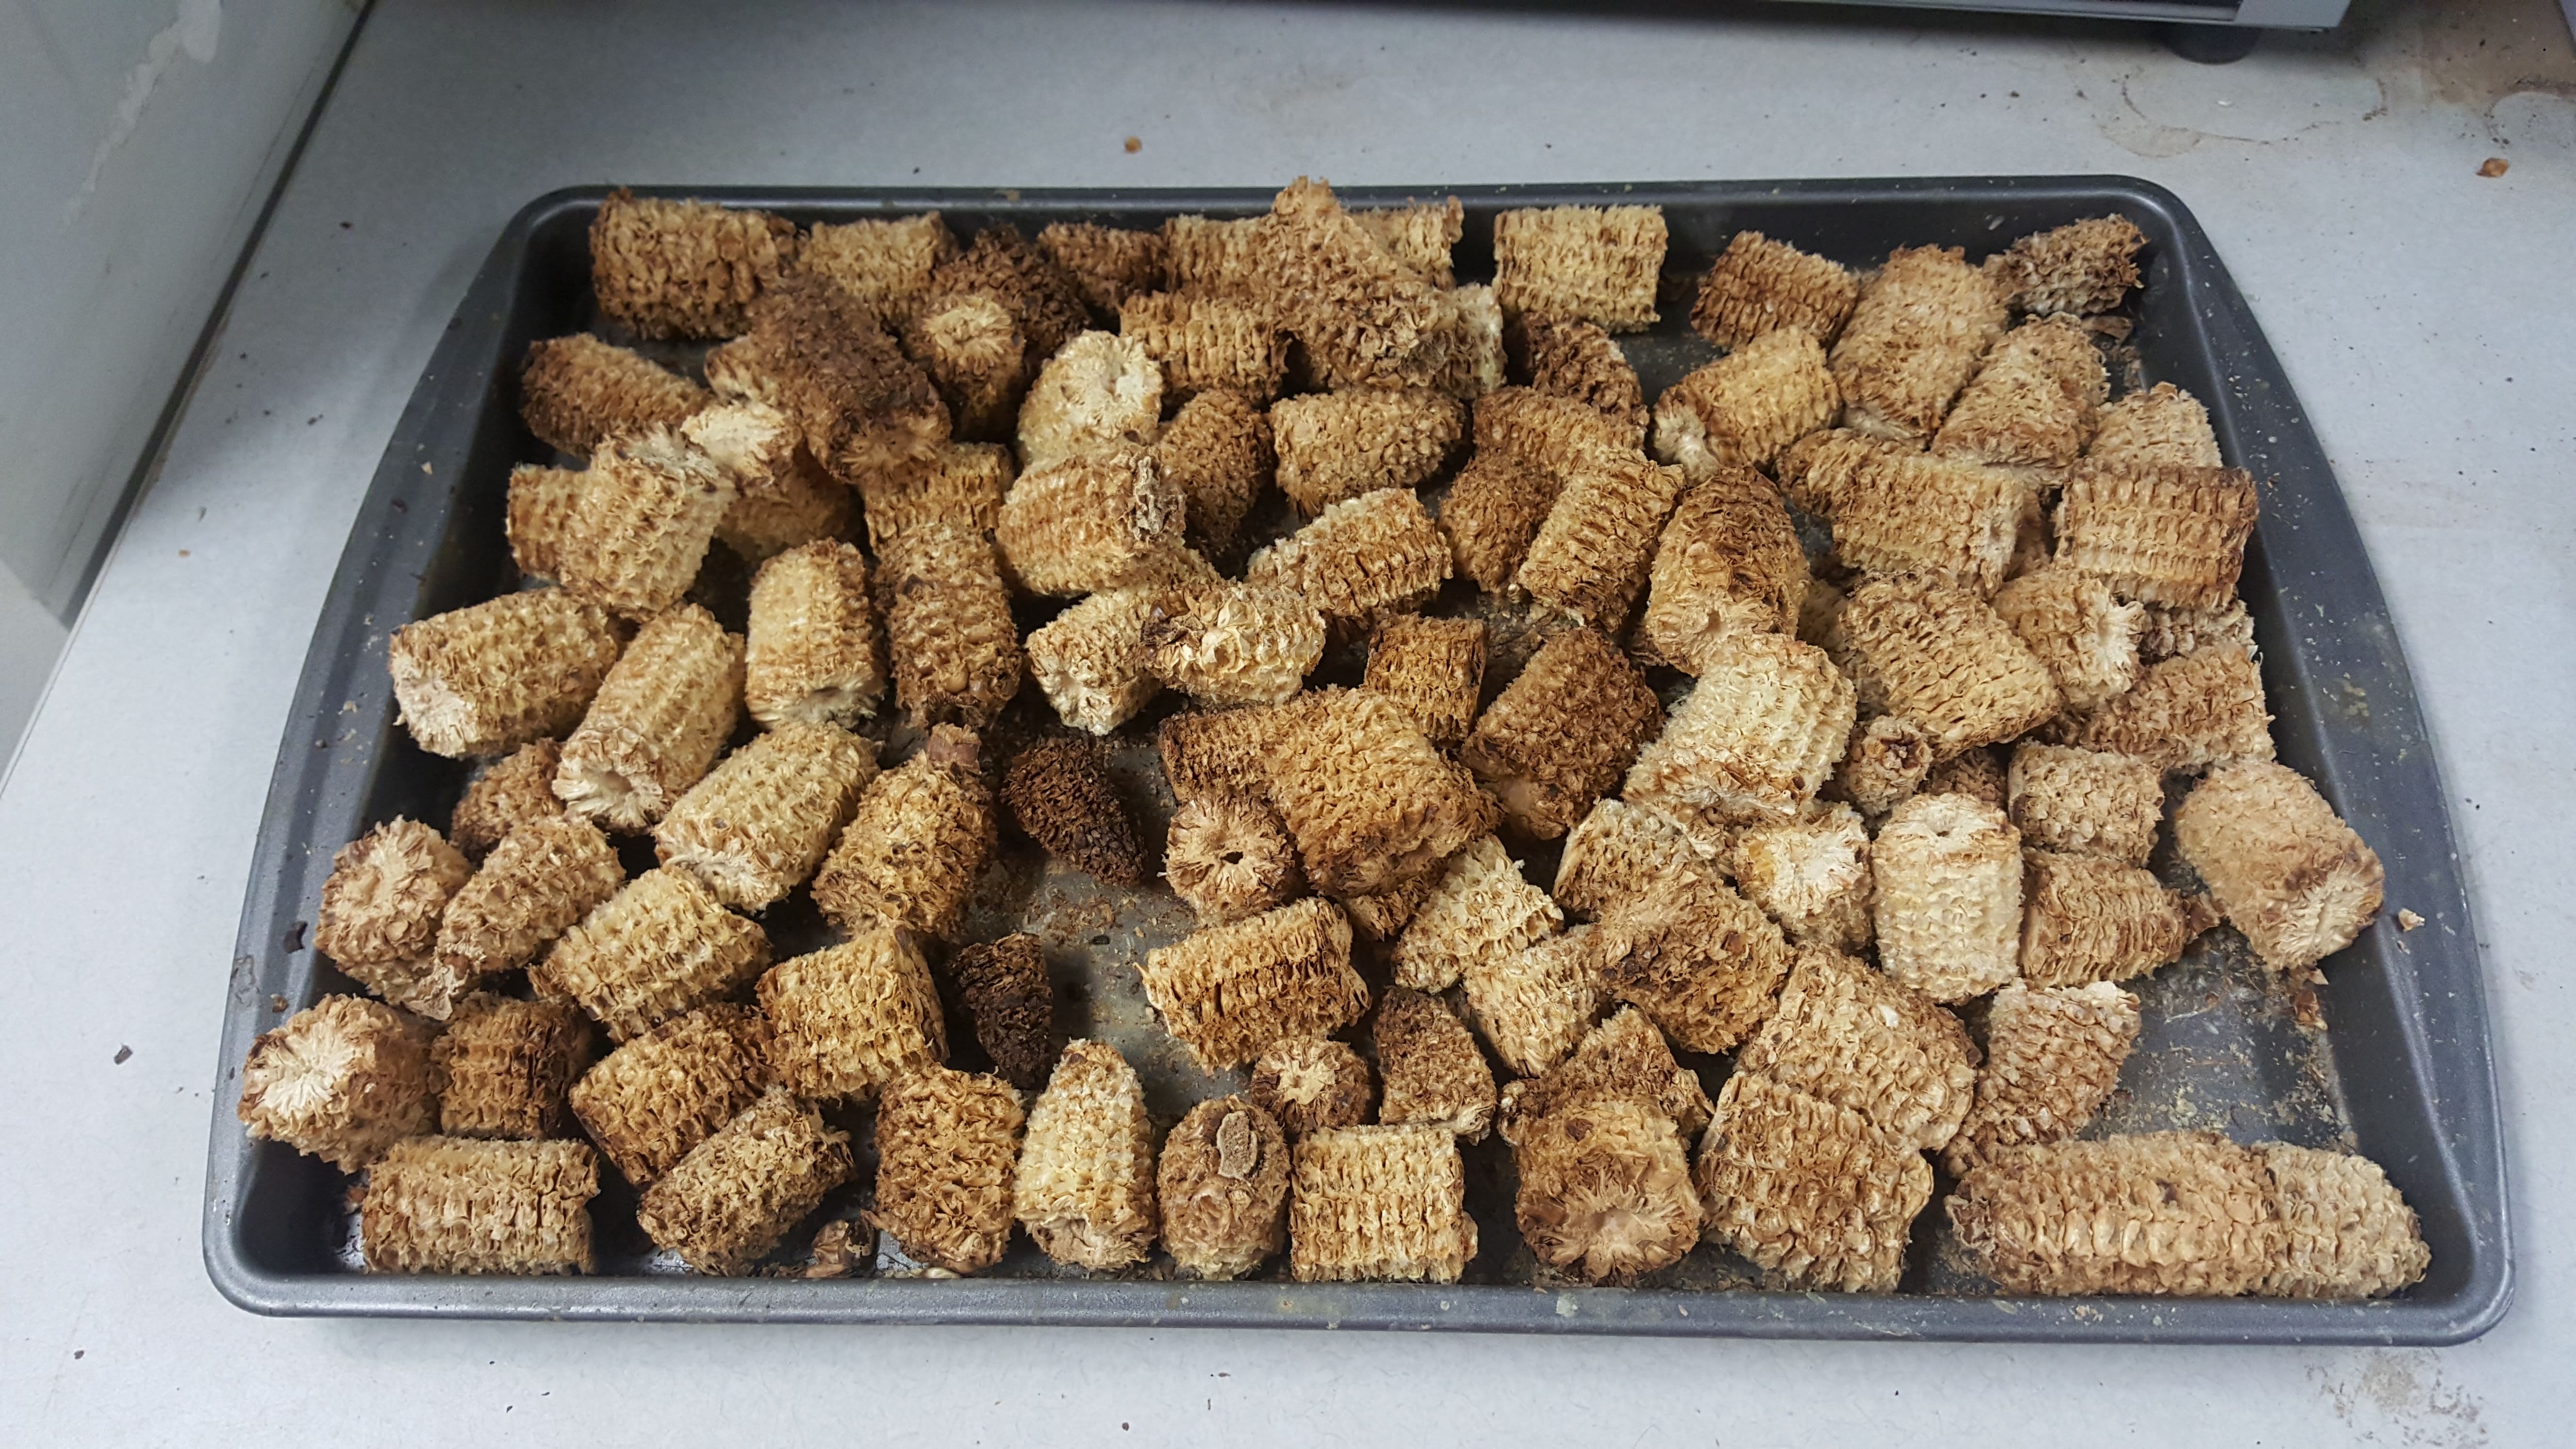
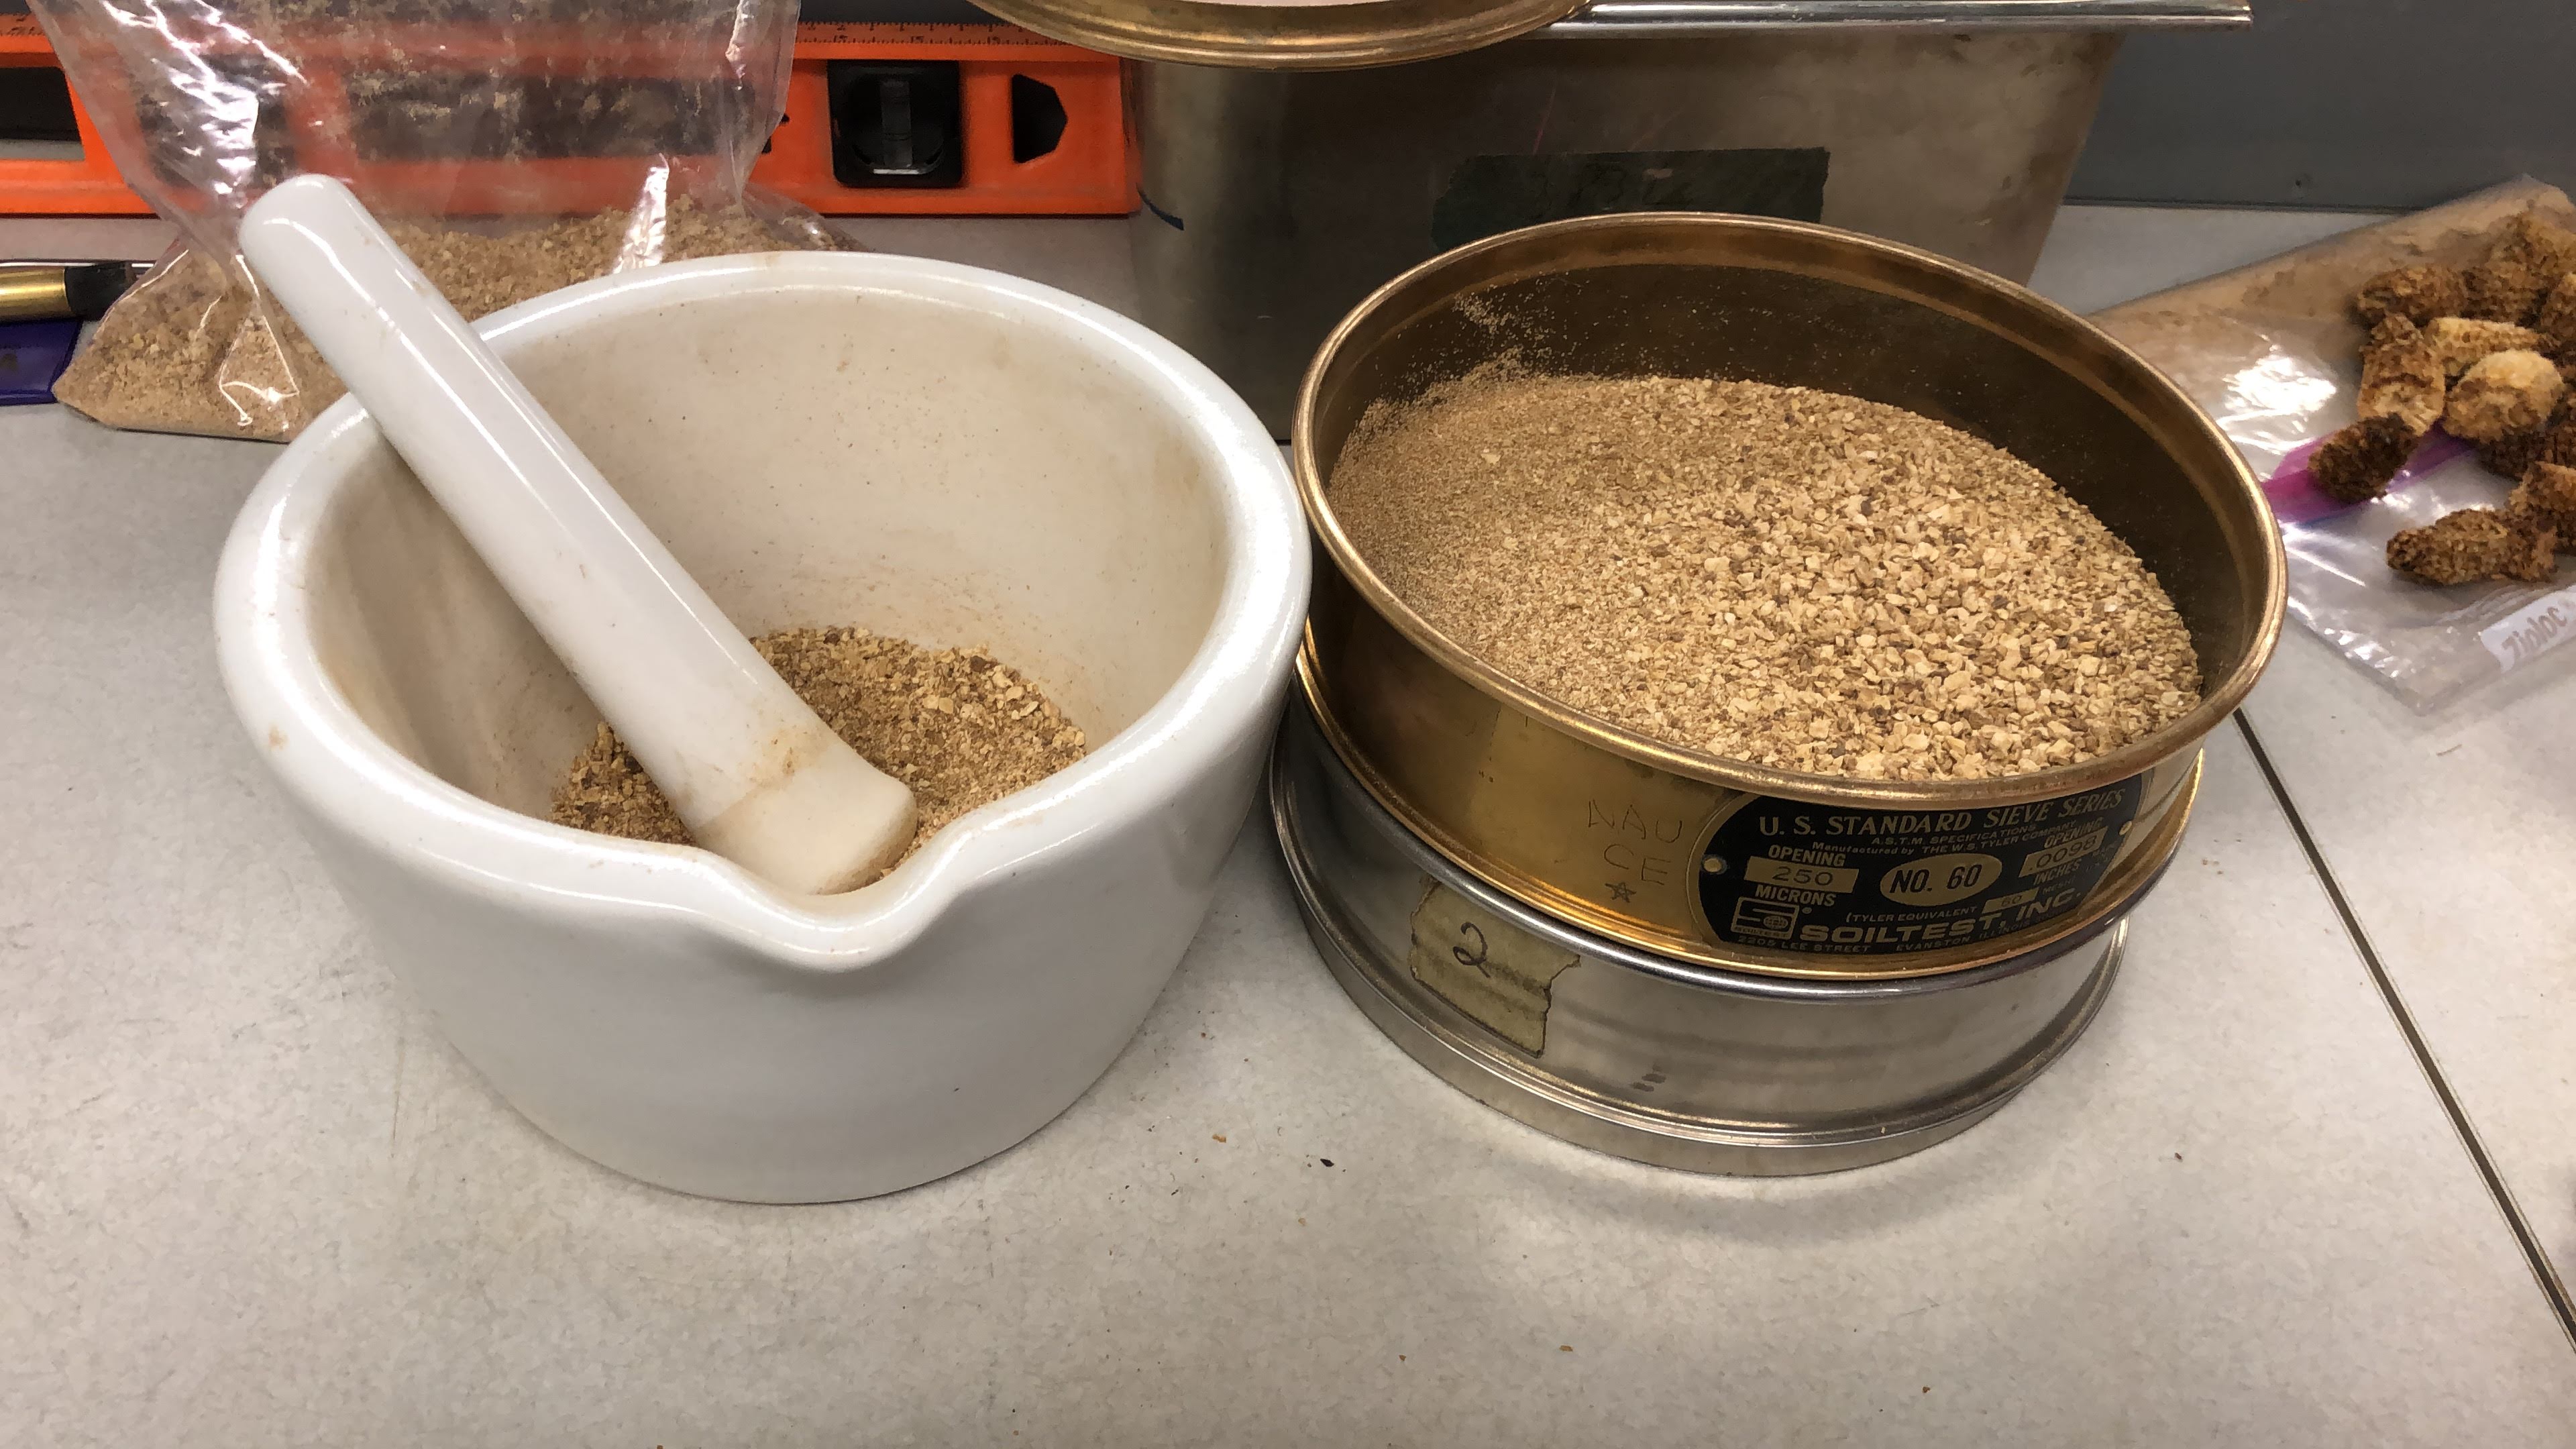
To prepare the corn cob biosorbent, the corn was first cut up into segments (Figure 1) and baked at 100 degrees Celsius for over 24 hours until it was completely dried. The kernels were separated from the cob (Figure 2) and the corncob was then broken down into fine particles that could pass through a 250 μm sieve (Figure 3).
Figure 1 (above) - Segmented corn cobs ready to be dried for 24 hours. Photo taken by Kileigh Phillips on February 22, 2020.
Figure 2 (above) - Corn cob that has already been dried and stripped of all kernels. This corn is ready for grinding and sieving. Photo taken by Kileigh Phillips on February 24, 2020.
Figure 3 (above) - Mortar and pestel used to grind the corn cob and the sieve used for the sieving of the corn cob. Photo taken by Kileigh Phillips on February 25, 2020.
Biosorbent activation refers to the process in which acids were used to enhance the sorption capacity of the prepared corn cob. A strong acid (nitric acid) and a weak acid (citric acid) were used for this research project. Both acids had a different procedure that was followed.
For the nitric acid treatment process, the corn cob was first saturated in the acid and then placed in a centrifuge to separate the liquid from the corn cob. The liquid was disposed of and the corn was then mixed with deionized (DI) water and placed in the centrifuge again to separate the liquid from the corn cob. After the liquid was disposed of, the corn was placed in a drying oven until completely dried and then the process was repeated using sodium hydroxide instead of nitric acid in order to neutralize the pH.
Figure 4 (above) - Nitric acid activation process. Picture was taken after the "cooking" process of a nitric acid and corn cob solution was put into a drying oven. Photo taken by Erin Pflueger on March 3, 2020.
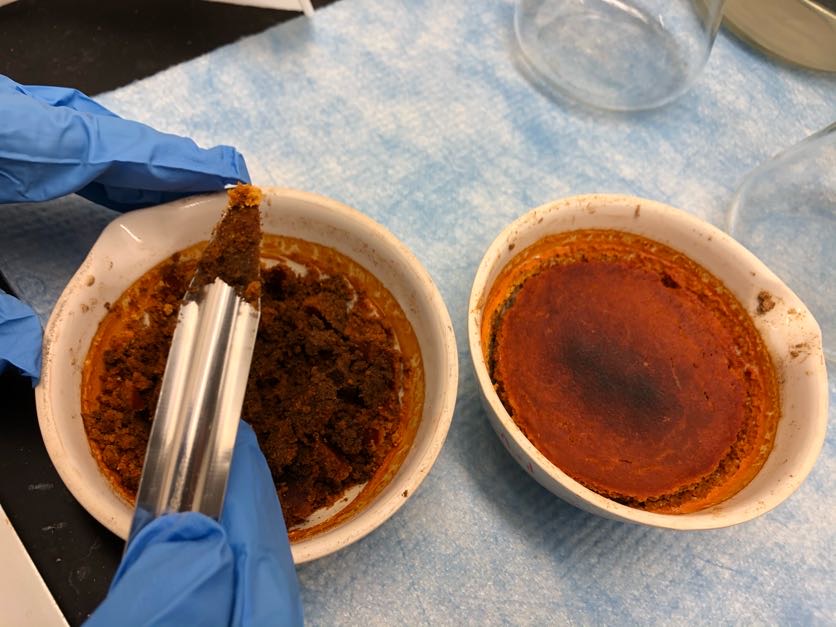
For the citric acid treatment process, the corn cob was washed with DI water and dried in an oven for over 24 hours. The corn cob was saturated with citric acid and placed in a drying oven again and all excess liquid was filtered away from the corn cob. The corn cob underwent another round of drying before it was thoroughly washed with DI water in order to neutralize the pH.
Figure 5 (above) - This photo was taken before the corn cob/citric acid solution was placed in a drying oven to "cook". Photo taken by Kileigh Phillips on February 21, 2020.
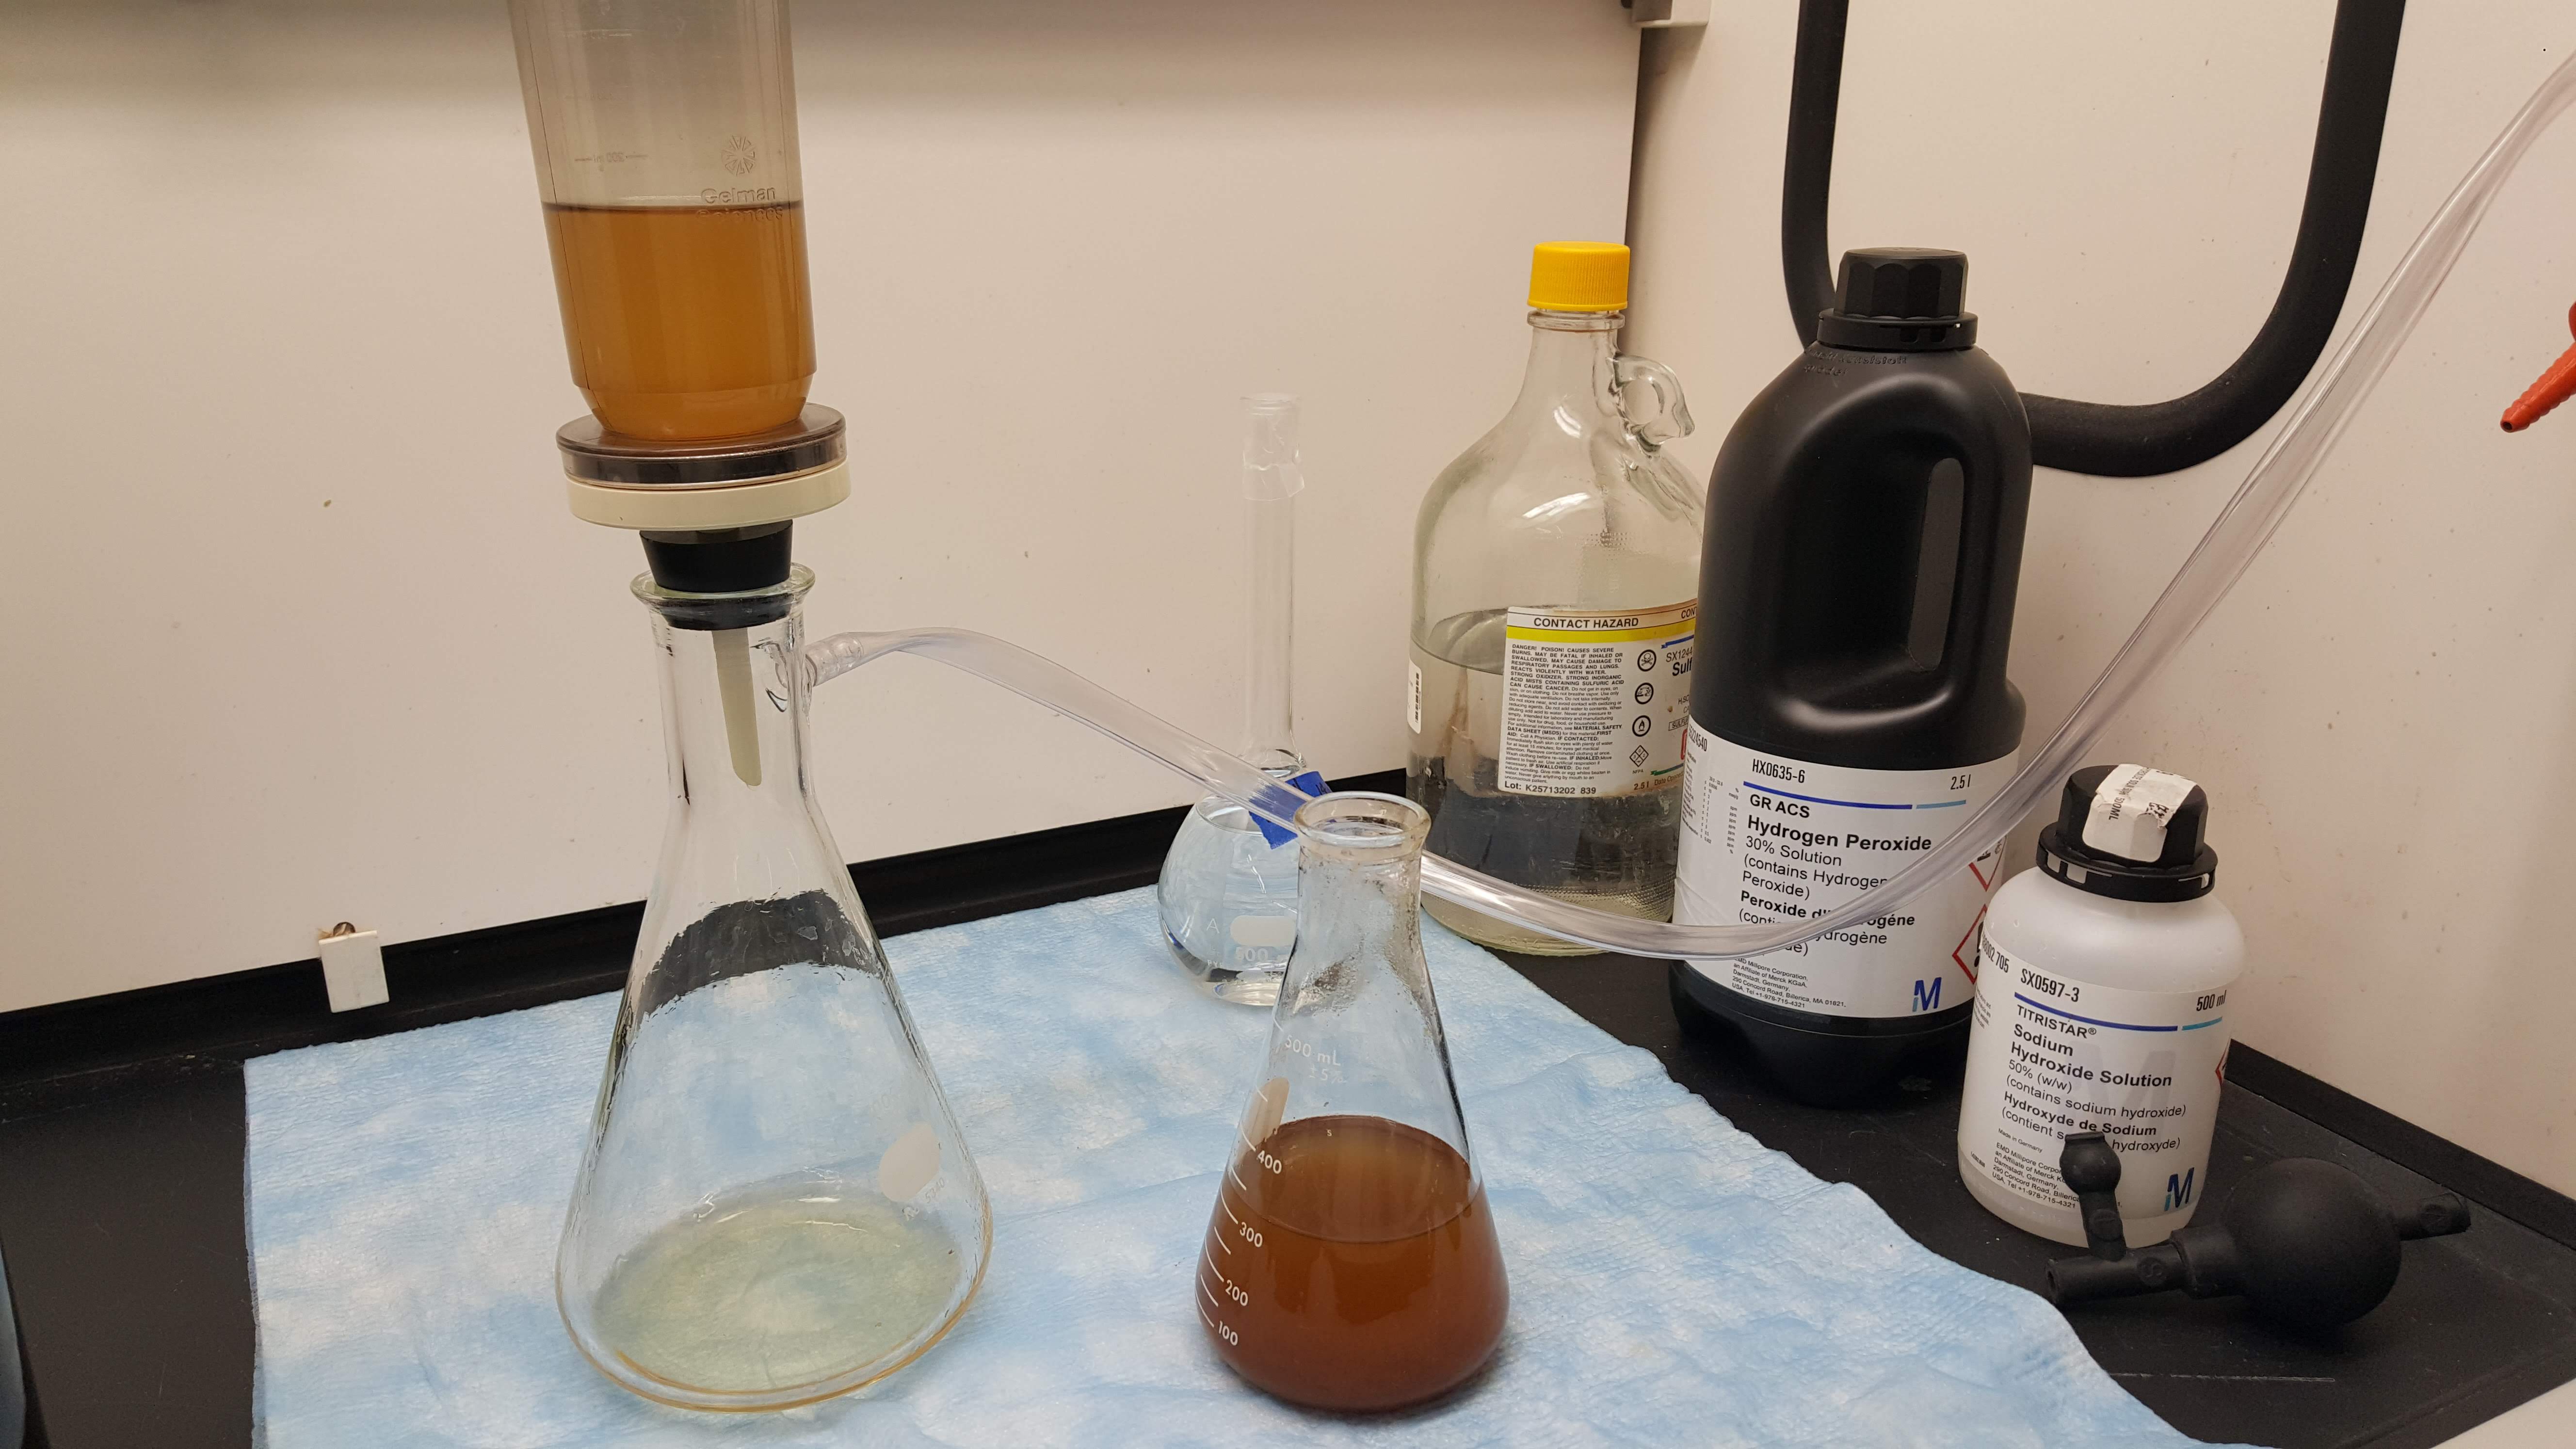
For the removal of each contaminate (Cadmium, Arsenic, and Total Coliform), various methodologies were necessary, all of which utilized a batch reaction simulation. The biosorbent was added to the contaminated water samples and the samples were set on a rotary shaker for a pre-determined time. After each batch reaction the samples were filtered to separate the liquid and the biosorbent in preparation for analysis. In addition to the specific contaminate removal tests, another type of test was required in order to determine the parameters by which the batch reaction worked the most effectively and maximized the amount of contaminant adsorbed onto the corn cob. This test was done to further develop an XRF methodology and complete Objective 4.
Figure 6 (above) - Batch reaction being set up with Cadmium contaminated water samples being treated with nitric acid activated corn cob. Photo taken by Thalius Belinti on March 9, 2020.
Figure 7 (above) - Corn cob being filtered from Cadmium contaminated water. This is after the batch reaction process and has to be done prior to sending the samples for ICP-MS analysis. Photo taken by Kileigh Phillips on March 1, 2020.
The Cadmium testing methodology was a direct repetition of last year’s methodology. 7 concentrations were tested; the 3 highlighted in the experimental matrix were duplicates from last year’s concentration range (10 μg/L, 20 μg/L, and 75 μg/L), the other 4 were chosen by the team (5 μg/L, 40 μg/L, 60 μg/L, 100 μg/L). Nitric acid activated corn was the only biosorbent type tested with Cadmium. One gram of nitric acid activated corn cob was deposited into each sample and placed on the rotary shaker for 90 minutes at 250 rpm. The samples were filtered twice, once using a 47 μm glass fiber filter and another time using a 45 μm glass fiber filter. The samples were acid-preserved at a pH of 2 or below using 1M nitric acid. Three replicates of each sample were performed. The experimental matrix outlining all of this can be found below.
Cadmium Testing Experimental Matrix
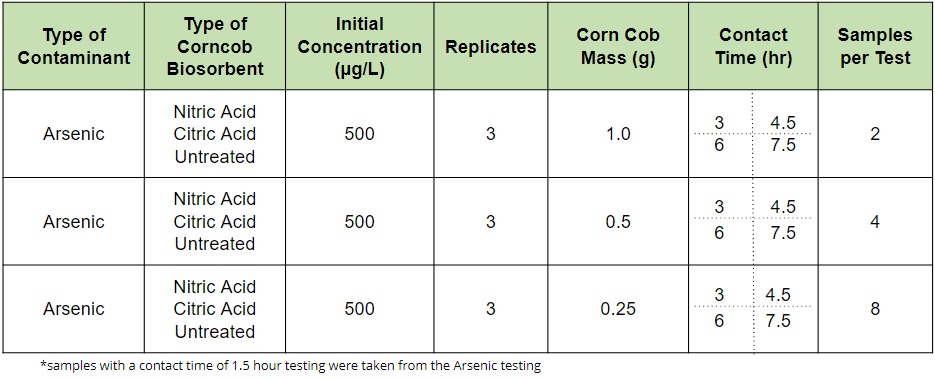
The XRF device has a very high limit of detection for Arsenic (5 mg/L) relative to the concentrations that are tested for drinking water research projects, typically in the unit of μg/L. For the reason, in order to develop the XRF methodology, the parameters at which the batch reactions worked most effectively in maximizing the amount of contaminant adsorbed to the corn needed to be determined. The parameters of interest were the mass of biosorbent added to each sample and the contact time, or duration of the batch reaction. As seen in the experimental matrix below, 3 masses and 4 contact times were chosen for testing. The only concentration tested was 500 μg/L. The number of samples per test differs for each mass of biosorbent added to the samples and that is because the XRF device needs at least 2 grams of biosorbent in each XRF cup to run one analysis. The XRF device was also used to analyze the liquid samples.
Sorption Capacity Testing Experimental Matrix
Arsenic Testing
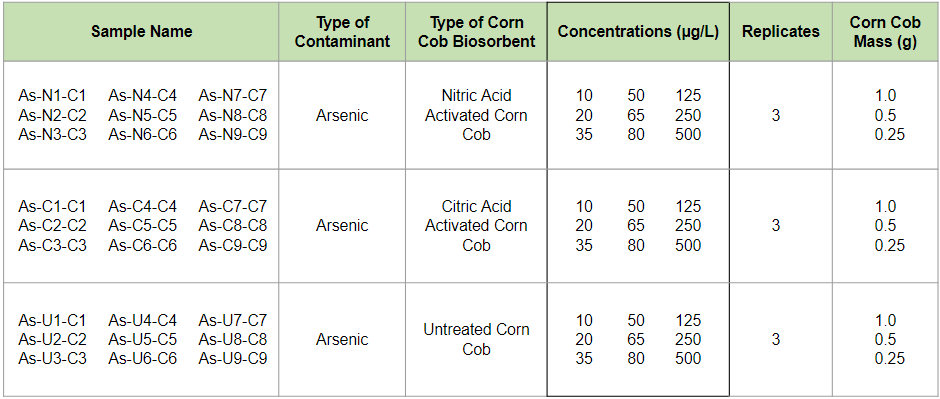
In hopes of creating an isotherm for the removal of Arsenic, the experimental matrix below was created. Sodium Arsenite was used to create a range of 9 Arsenic concentrations from 10 µg/L to 500 µg/L. All tests were conducted with the three masses of corn that were tested in the Sorption Capacity Test and this was because overlap in the samples gathered between the two tests was desired in order to compare the XRF results from the Sorption Capacity Test with the ICP-MS results from this test.
Arsenic Testing Experimental Matrix
Total Coliforms Testing
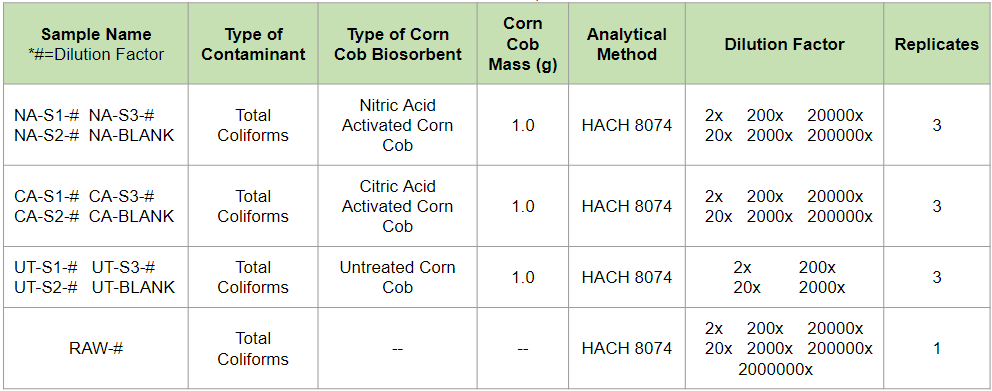
A primary effluent water sample was treated with 1 gram of biosorbent to test for the removal of Total Coliforms using a corn cob biosorbent. All three biosorbents were tested and triplicates of each test were prepared for quality assurance. Once the batch reaction was completed, the samples were filtered and the liquid was analyzed using HACH Method 8074. A serial dilution is required for this methodology and the dilution factors that were used ranged between 2 and 2,000,000. Blanks with DI water and 1 gram of biosorbent were tested to analyze the corn’s Total Coliforms contamination. The raw wastewater was also analyzed using HACH Method 8074 to give a preliminary count of colony forming units (CFUs) to compare to the CFU counts in the treated water samples.
Total Coliforms Testing Experimental Matrix
 Analysis Methods
Two pieces of analytical equipment were used to analyze the removal of heavy metal testing. An ICP-MS instrument, seen in Figure 8, has the ability to detect low levels of contaminants and allowed for realistic drinking water contamination levels to be tested for Cadmium and Arsenic with very little, if any, instrumental uncertainty. An XRF device, as seen in Figure 9, was only used for Arsenic analysis. The XRF was used to analyze both the solid corn cob and the liquid from each test. The samples were placed in the small white cups seen to the left of the XRF device. The analytical process of the Total Coliforms tests can be followed in Figures 10 through 14. Figure 10 shows the broth utilized in HACH Method 8074 called m-Endo. Each sample was placed in a petri dish containing this pink liquid. Figure 11 shows the serial dilution process that was conducted prior to the filtration of each sample dilution onto the method specific gridded filters, seen in Figure 12. Figure 13 shows a Petri dish prepared for the 24-hour incubation period. Figure 14 shows a sample after the incubation period where the CFUs were being counted below a magnifying glass.
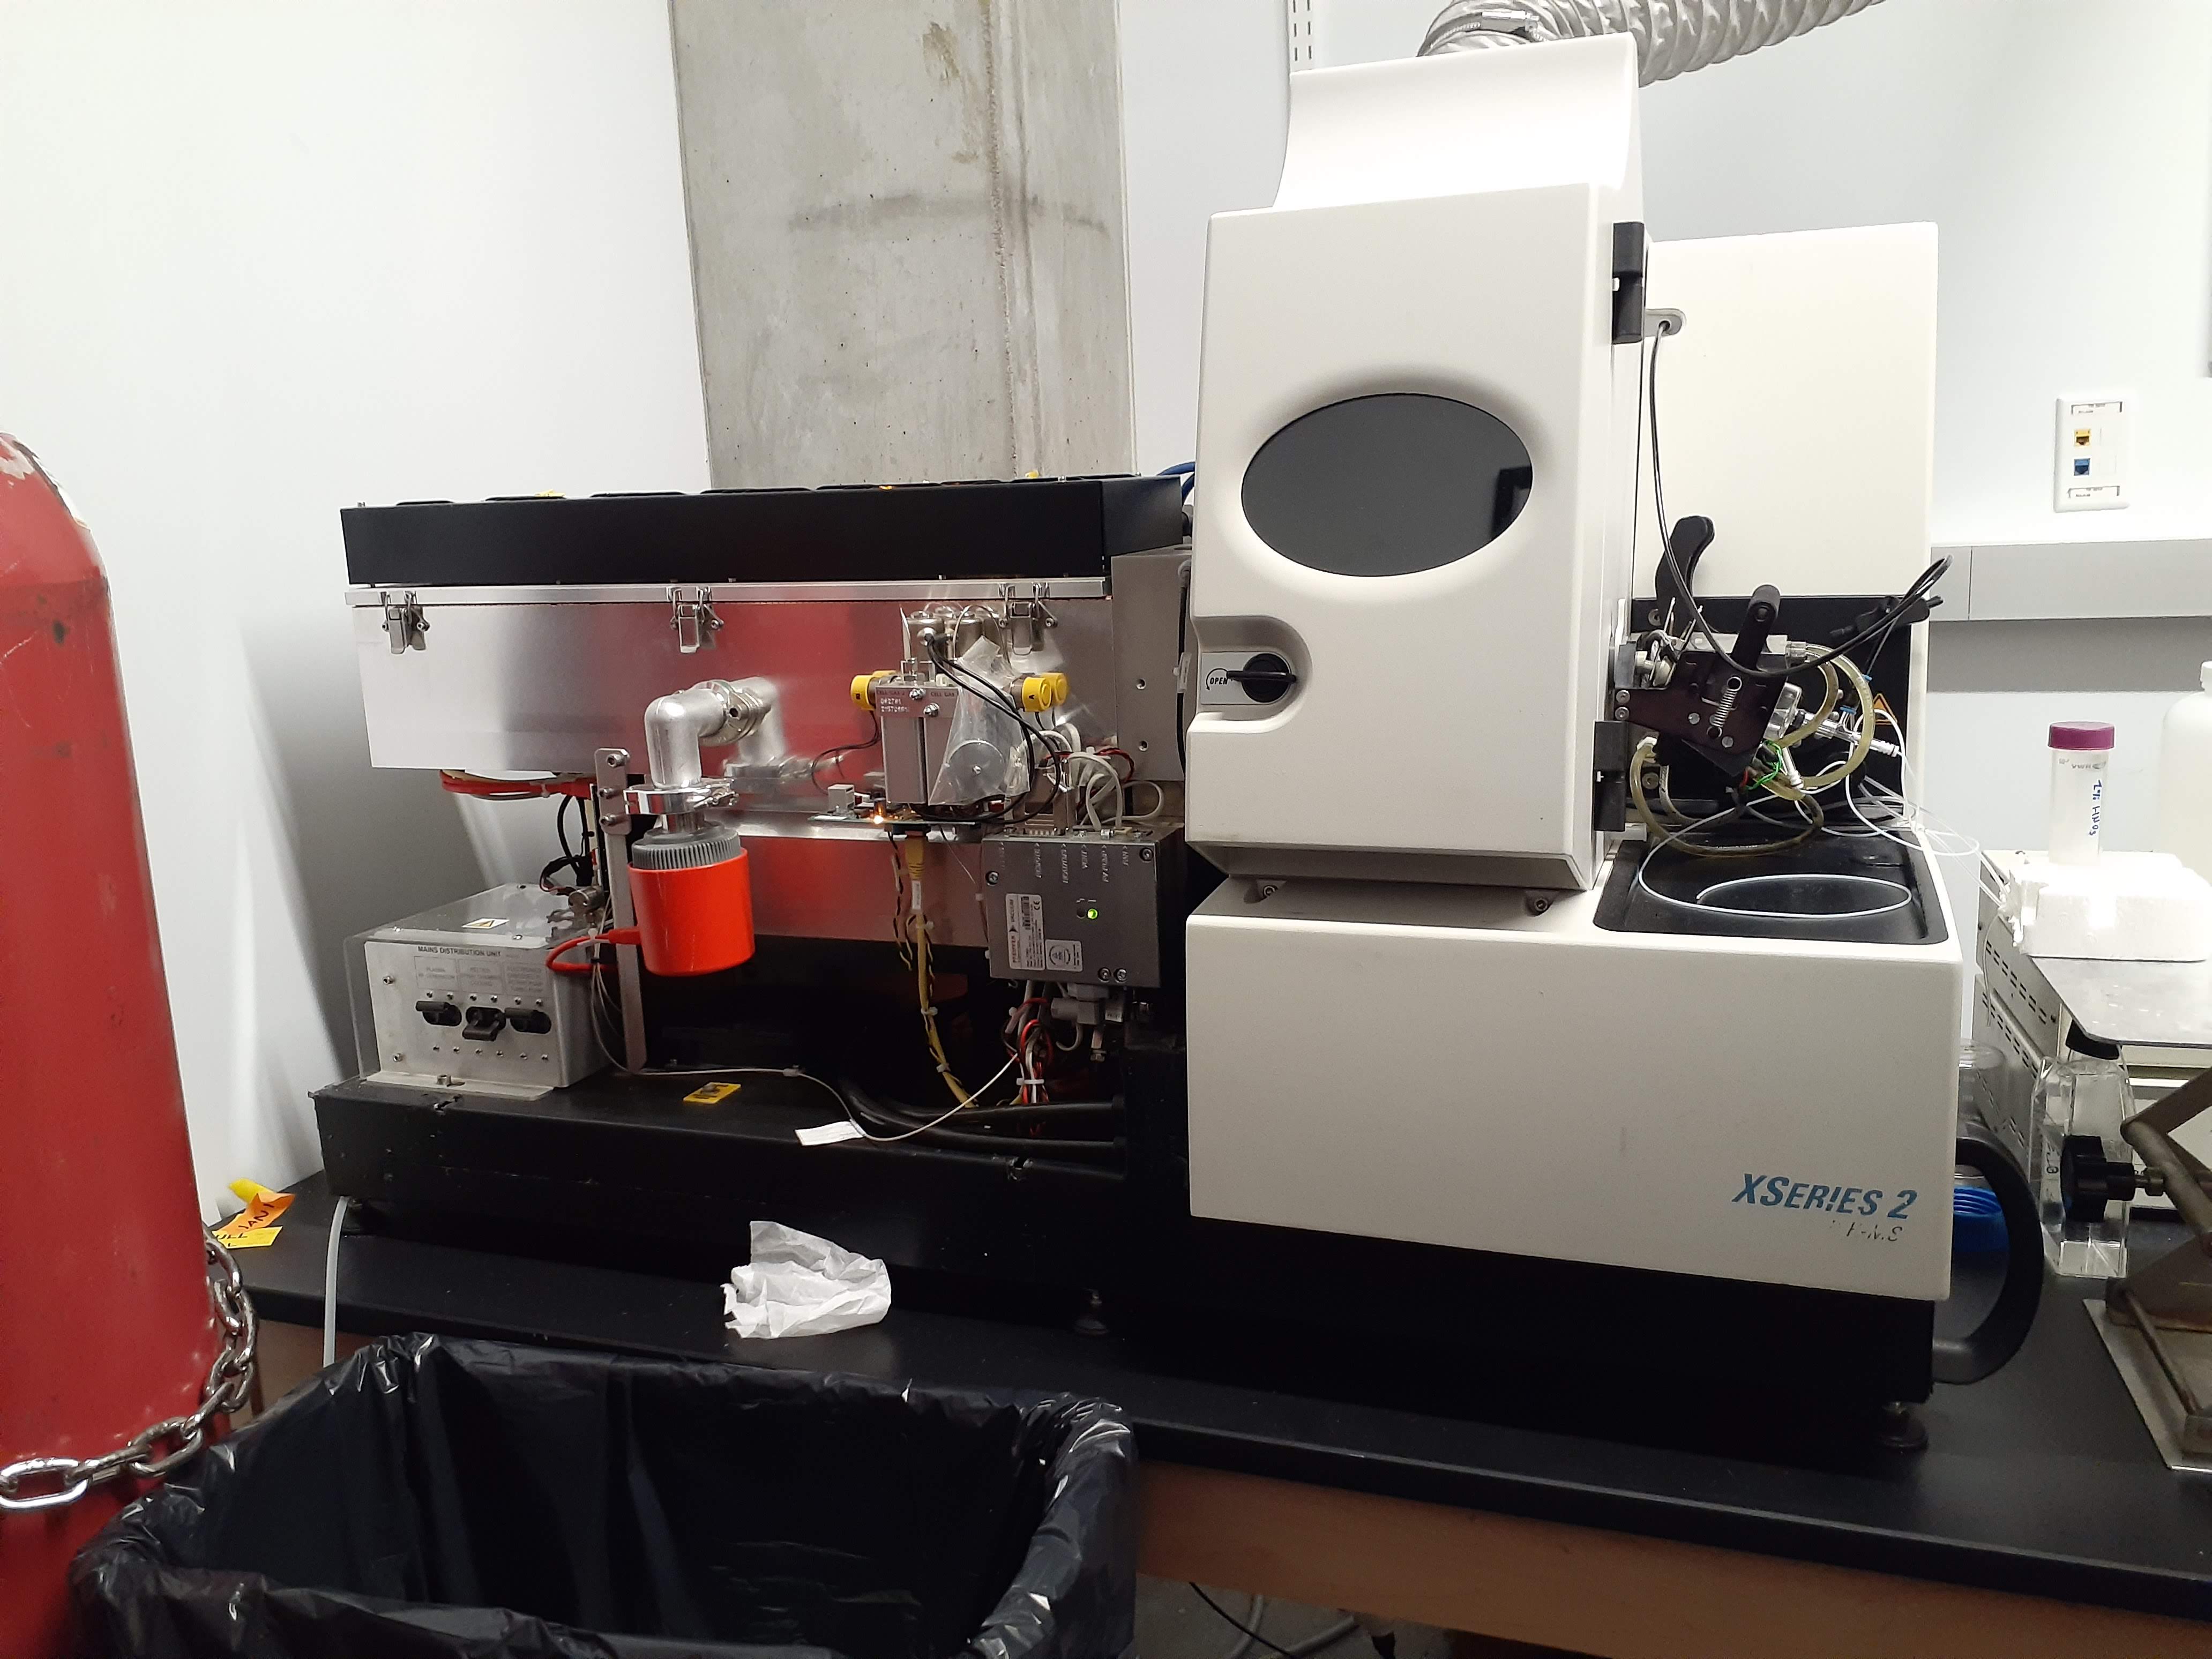
Figure 8 (above) - ICP-MS instrument in Chemistry Department used to analyze data. Photo taken by Thalius Belinti on March 2, 2020.
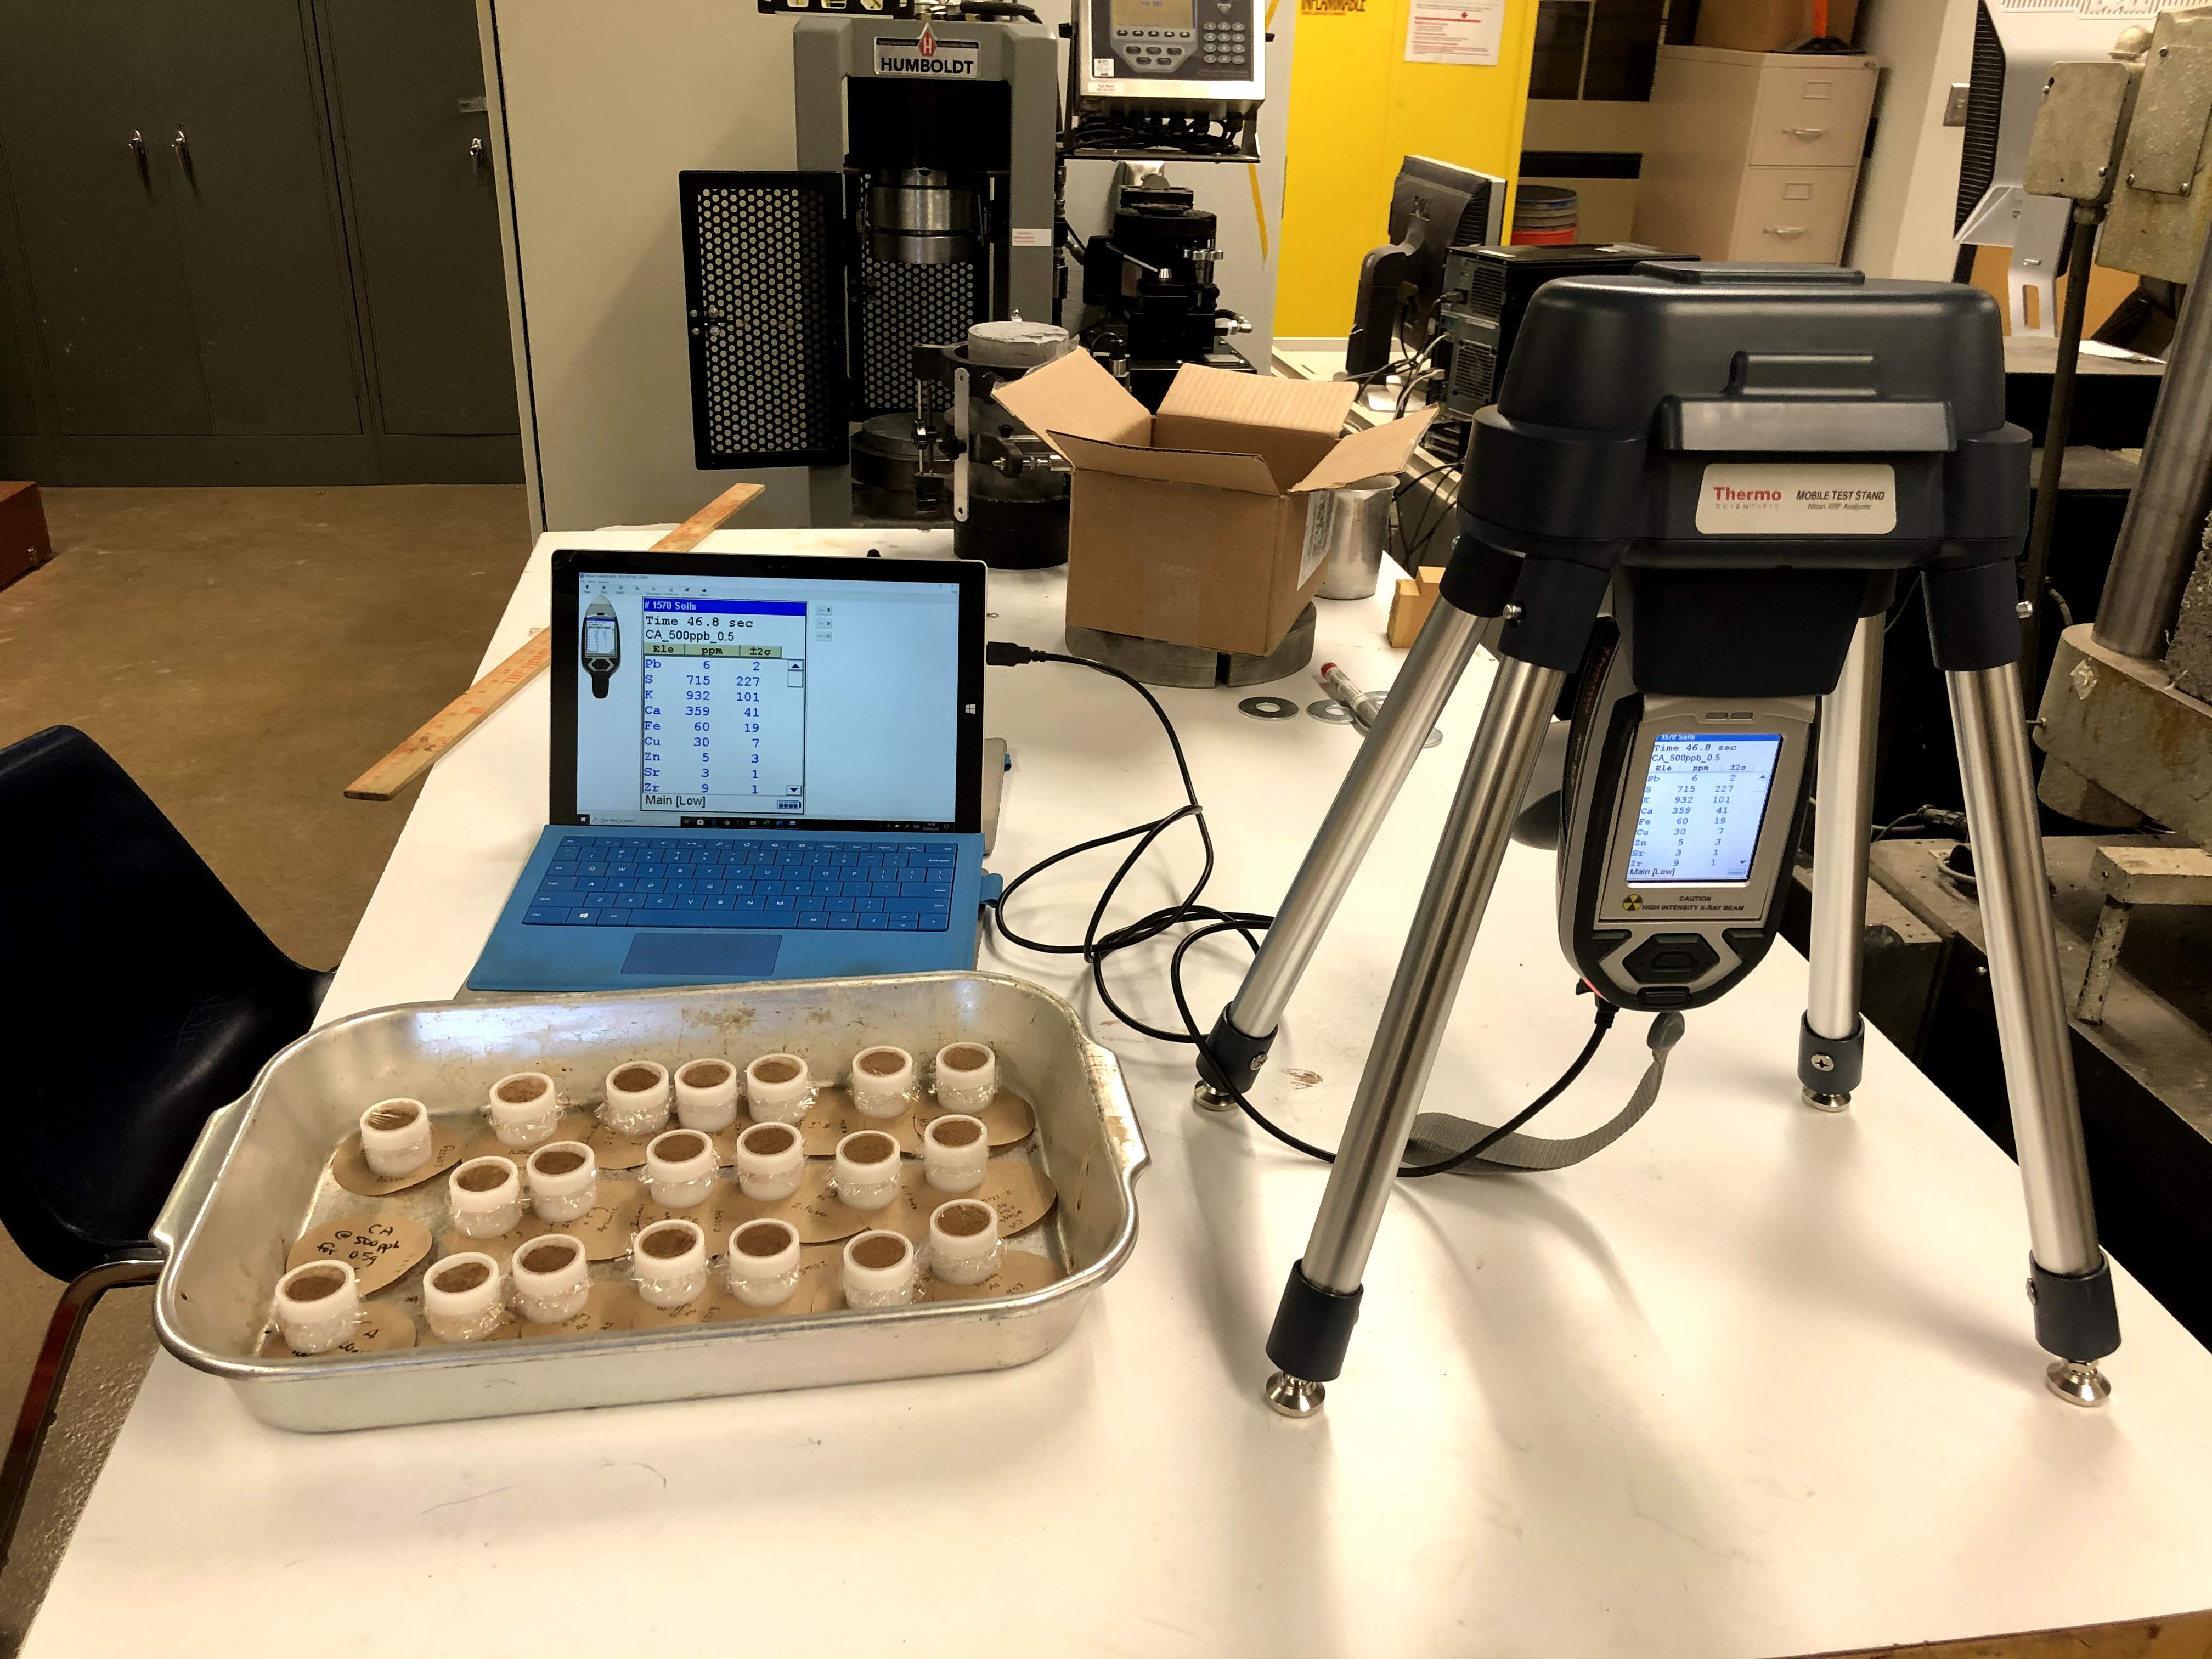
Figure 9 (above) - XRF device hooked up to computer program to do preliminary readings of the biosorbent to determine any preexisting contaminates in the corn cob. Photo taken by Kileigh Phillips on March 5, 2020.
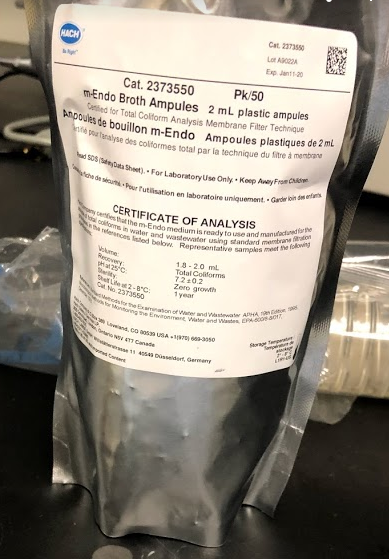
Figure 10 (above) - Broth used for HACH Method 8074 called m-Endo. It has a very pink color. Photo taken by Kileigh Phillips on March 24, 2020.
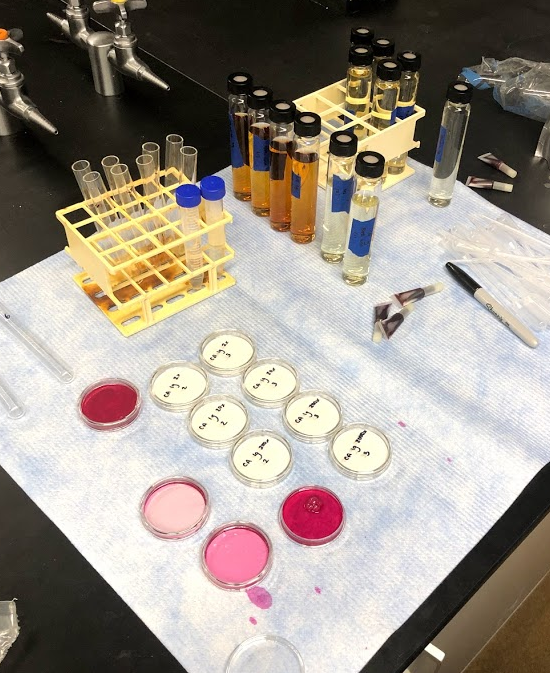
Figure 11 (above) - Serial dilution that each sample underwent after the batch reaction process. Dilution factors ranged between 2 and 2,000,000. Photo taken by Kileigh Phillips on March 24, 2020.
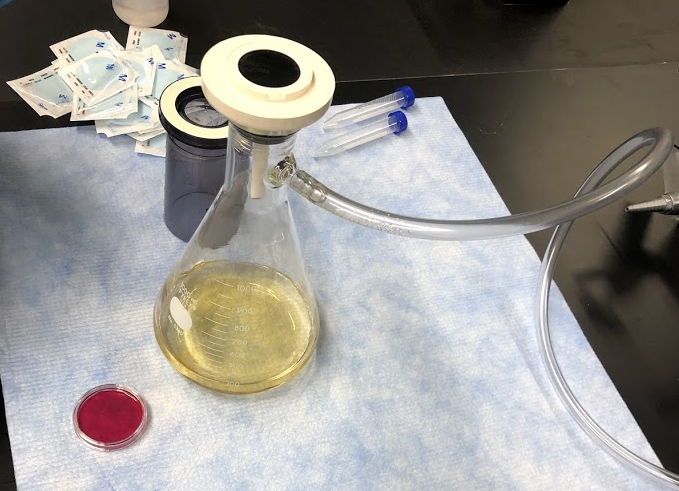
Figure 12 (above) - Final filtration done for each dilution of every sample onto the method specific filters. Photo taken by Kileigh Phillips on March 24, 2020.
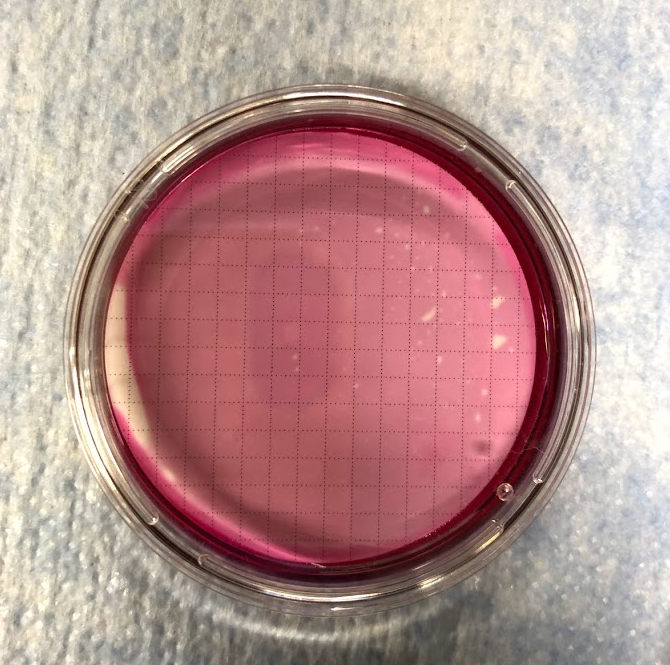
Figure 13 (above) - Sample in a Petri dish with m-Endo broth, ready for incubation. Photo taken by Kileigh Phillips on March 24, 2020.
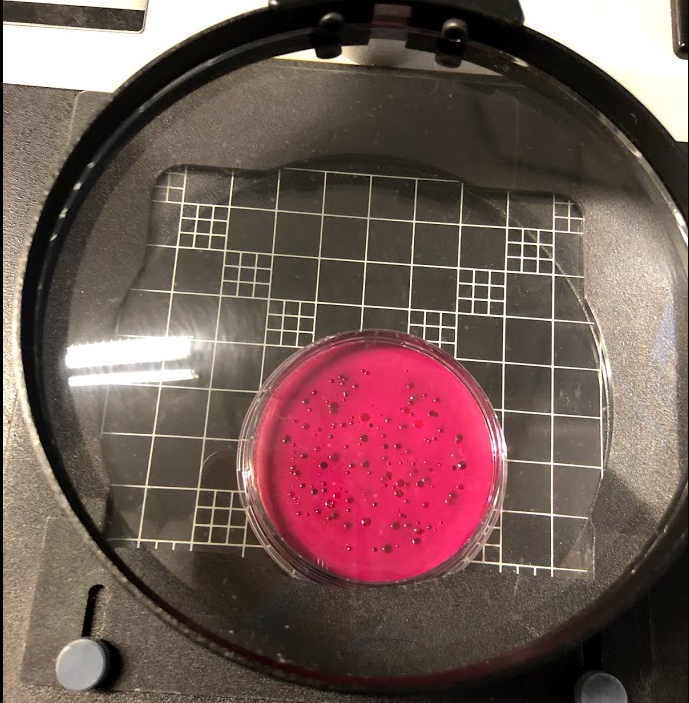
Figure 14 (above) - Coliform colonies under the magnifying glass used to count the number of colony forming units (CFUs) for Total Coliforms testing. Photo taken by Kileigh Phillips on March 24, 2020.
Updated: 5 May 2020, 10:00AM
Copyright © 2015 · All Rights Reserved
Two pieces of analytical equipment were used to analyze the removal of heavy metal testing. An ICP-MS instrument, seen in Figure 8, has the ability to detect low levels of contaminants and allowed for realistic drinking water contamination levels to be tested for Cadmium and Arsenic with very little, if any, instrumental uncertainty. An XRF device, as seen in Figure 9, was only used for Arsenic analysis. The XRF was used to analyze both the solid corn cob and the liquid from each test. The samples were placed in the small white cups seen to the left of the XRF device. The analytical process of the Total Coliforms tests can be followed in Figures 10 through 14. Figure 10 shows the broth utilized in HACH Method 8074 called m-Endo. Each sample was placed in a petri dish containing this pink liquid. Figure 11 shows the serial dilution process that was conducted prior to the filtration of each sample dilution onto the method specific gridded filters, seen in Figure 12. Figure 13 shows a Petri dish prepared for the 24-hour incubation period. Figure 14 shows a sample after the incubation period where the CFUs were being counted below a magnifying glass.
Figure 8 (above) - ICP-MS instrument in Chemistry Department used to analyze data. Photo taken by Thalius Belinti on March 2, 2020.
Figure 9 (above) - XRF device hooked up to computer program to do preliminary readings of the biosorbent to determine any preexisting contaminates in the corn cob. Photo taken by Kileigh Phillips on March 5, 2020.
Figure 10 (above) - Broth used for HACH Method 8074 called m-Endo. It has a very pink color. Photo taken by Kileigh Phillips on March 24, 2020.
Figure 11 (above) - Serial dilution that each sample underwent after the batch reaction process. Dilution factors ranged between 2 and 2,000,000. Photo taken by Kileigh Phillips on March 24, 2020.
Figure 12 (above) - Final filtration done for each dilution of every sample onto the method specific filters. Photo taken by Kileigh Phillips on March 24, 2020.
Figure 13 (above) - Sample in a Petri dish with m-Endo broth, ready for incubation. Photo taken by Kileigh Phillips on March 24, 2020.
Figure 14 (above) - Coliform colonies under the magnifying glass used to count the number of colony forming units (CFUs) for Total Coliforms testing. Photo taken by Kileigh Phillips on March 24, 2020.
.jpg)
