
Scope
Project Overview
In regions such as Arizona, significant water losses occur in open canal systems due to evaporation. The deployment of solar panels over canals has been proposed as a potential dual benefit solution for reducing evaporation while generating renewable energy. However, the lack of experimental data on how canal water evaporation is influenced by parameters such as surface temperature, relative humidity, wind speed, and overhead panel coverage limits the ability to validate this solution. Without controlled experimentation, it is difficult to quantify the evaporation rate and provide recommendations that are both scientifically rigorous and relevant to real world canal management. The objective of this project is to design and operate a controlled apparatus that models canal conditions under turbulent free convection to measure and analyze evaporation rates. After confirming turbulent free convection with a flow visualization test, we will conduct three iterations of the experiment:
If all results from previous experiments are satisfactory, and time permits, we will expand the experimentation to include forced convection. Through these tests, the experiment aims to generate clear, quantitative data that can validate theoretical mass transfer models and supports SRP’s ongoing assessment of solar over canal systems.
Key Objectives
- Find an exact percentage that evaporation is reduced by shading
- Develop a system that defines boundary conditions for our application
- Define a solution that is environmentally sustainable
- Determine if the system is economically viable for large-scale implementation
Location
Primary Research Site
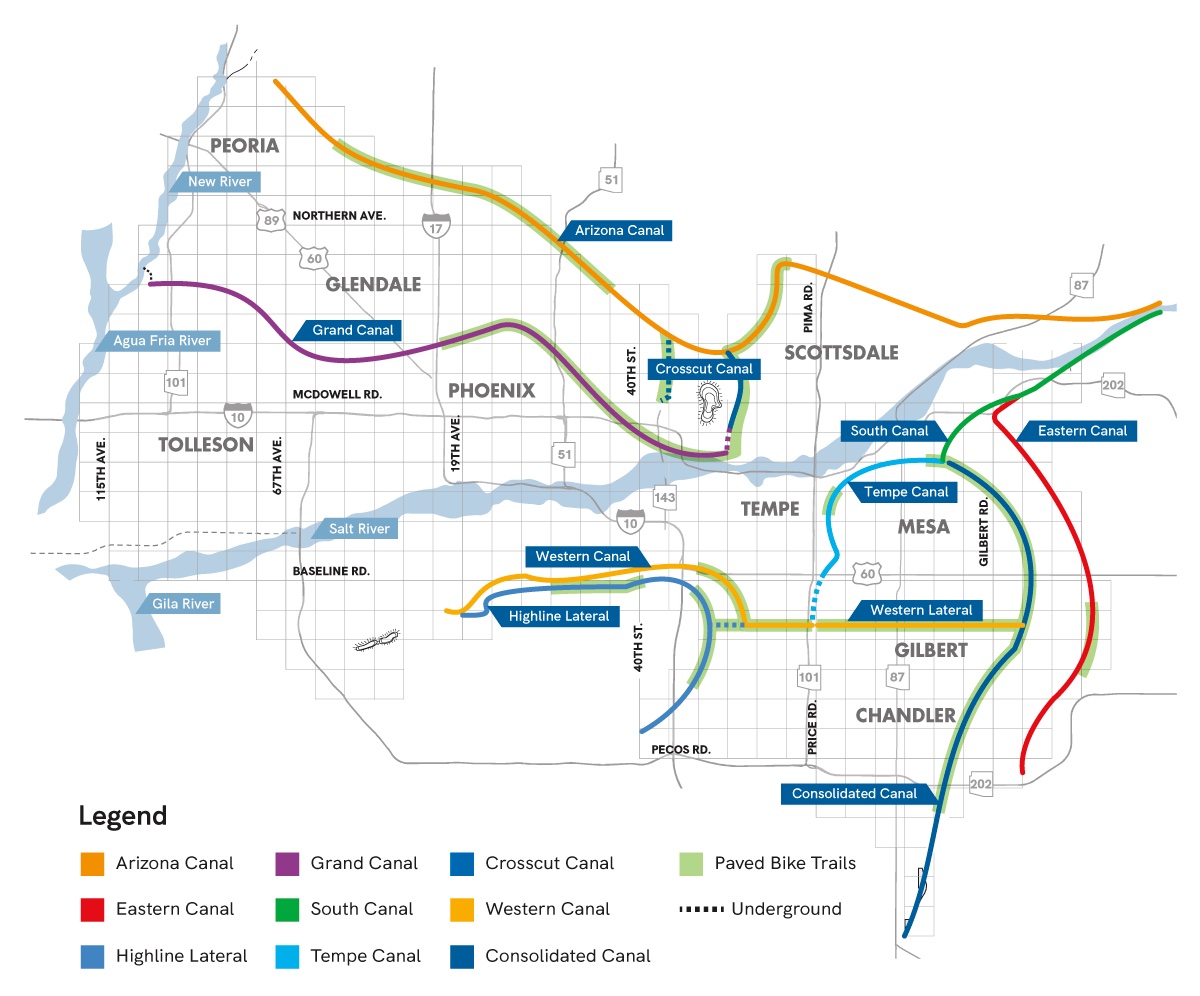
Our primary testing location is the Phoenix area, which experiences significant water loss due to evaporation. Due to our location in Flagstaff the team must crreate an apparatus that can immitate typical Arizona climate conditions that one would experience in the valley.
Additional Sites
Similar sites could occur at smaller SRP reservoirs to evaluate scalability and adaptation to different environments. These include:
- Horse Mesa Dam Reservoir
- Mormon Flat Dam Reservoir
- Stewart Mountain Dam Reservoir
Constraints
Customer Requirements
- The apparatus must reproduce air temperatures representative of Phoenix canal conditions, allowing the system to maintain steady-state temperature differences between the water surface and the surrounding air. For this requirement, an internal air conditioning system and proper insulation would help insure temperature setpoints are held for the duration of testing.
- With evaporation driven by the buoyant forces, the ability to properly maintain the water temperature is a requirement. The apparatus must sustain precise and repeatable water temperatures, and drives the need for a precise water heater and multiple thermocouples correctly placed for accurate data to be returned. Water temperatures must stay stable throughout the entire testing process.
- The evaporation rate depends on the vapor concentration gradient directly above the water surface. The apparatus must be capable of setting and maintaining a target RH value that directly correspond to Phoenix conditions. This requirement motivates the use dehumidification with tools such as desiccant packages, dehumidifiers and an overall airtight insulation to prevent the buildup of water vapor in the testing apparatus.
- The system must integrate the use of calibrated humidity sensors with sufficient accuracy and stability to capture the transient and steady state relative humidity values. Since the difference in humidity drives mass transfer, inaccurate readings would directly affect the Sherwood numbers. The sensors must remain stable over long durations of testing and be readable at fixed time intervals with automated data collection.
- The apparatus must operate within the turbulent free-convection regime (Gr∙Sc >2x10^7), confirmed through a flow visualization test and dimensionless analysis. This ensures that the experimental Sherwood- Rayliegh relationships are physically meaningful and scalable to the canal conditions. This requirement guarantees that buoyancy governs the evaporation mass flux and not forced airflow.
- All design decisions including the water tank, climate system, sensors, insulation, and data-acquisition hardware, must fall within the predetermined budget constraints. The components bought must be cost effective while still meeting the accuracy, durability, and precision needs necessary for scientific validity.
- The apparatus must operate leak-free over the extended test periods. The water tank, siphon, and surrounding frame must withstand multiple days of exposure without seepage or structural degradation. A 24 hour leak test must confirm that there is no unexpected water loss.
CR-1: Ability to Control and Maintain Air Temperature
CR-2: Ability to Control and Maintain Water Temperature
CR-3: Ability to Control and Maintain Relative Humidity (RH)
CR-4: Ability to Control and Maintain Air Temperature
CR-5: Ability to Maintain a Convective Flow Regime Representative of the Grand Canal
CR-6: Project Must Stay Within Budget
CR-7: Maintain Water tightness and Structural Integrity
Engineering Requirements
- All logged data must be captured at consistent intervals with minimal noise to accurately collect the data for mathematical calculations. Sampling rates and data logging must remain constant to allow accurate calculations of the vapor density gradients, convective coefficients, and non-dimensional parameters.
- Temperature sensors must be pre-calibrated or calibrated at multiple reference temperatures (boiling, ambient, and freezing) to achieve a minimum of ± 0.5°C accuracy. The humidity sensor must remain within ± 2% RH of known humidity. These accuracy thresholds ensure that the measured gradients are representative of the intended inputs and not sensor error.
- The apparatus must endure repeated thermal cycles, elevated temperatures, and dry air environments without structural degradation. Materials such as plywood, spray foam insulation, PVC pool liner, and framing must maintain at least a six month operation window. During the testing period the apparatus must be able to pass thermal degradation checks and have a load bearing factor of safety of at least 2.
- The apparatus must maintain geometric and boundary condition similarity to Phoenix’s Grand Canal. While scaled down, surface area representation and characteristic length must reflect the scaling factor that keeps the dimensionless parameters like the Rayliegh and Sherwood numbers.
- The system must operate within the correct turbulent natural convection regime, producing Grashof numbers within the order 0f 10^9 to 10^10, which is what is expected with the scaled conditions. This requirement ensures that the Sherwood correlation collected from the apparatus remain physically representative of canal evaporation.
- Material selection, required sensors, components, and construction must meet the cost target stated in the QFD. The cost must stay under $5765, including travel and transport of the apparatus for testing in Phoenix condition. Low cost but accurate sensors must be balanced with performance and precision to utilize the budget without under preforming.
- All tests must follow accepted mass transfer practices, including steady-state verification, variable isolation, repeated trials, dimensionless value analysis, and verification of the flow regime. Data collection methods must reduce bias and that the dependent variables respond solely to the controlled changes of air temperature, water temperature, and humidity.
ER-1: Precision of Data Collection
ER-2: Sensor Accuracy and Calibration
ER-3: Material Durability and Longevity
ER-4: Geometric Similarity to the Grand Canal
ER-5: Rayliegh/Grashof Number Scalability
ER-6: Economic Feasibility
ER-7: Adhere to Scientific Standards and Proper Experiment Methodology
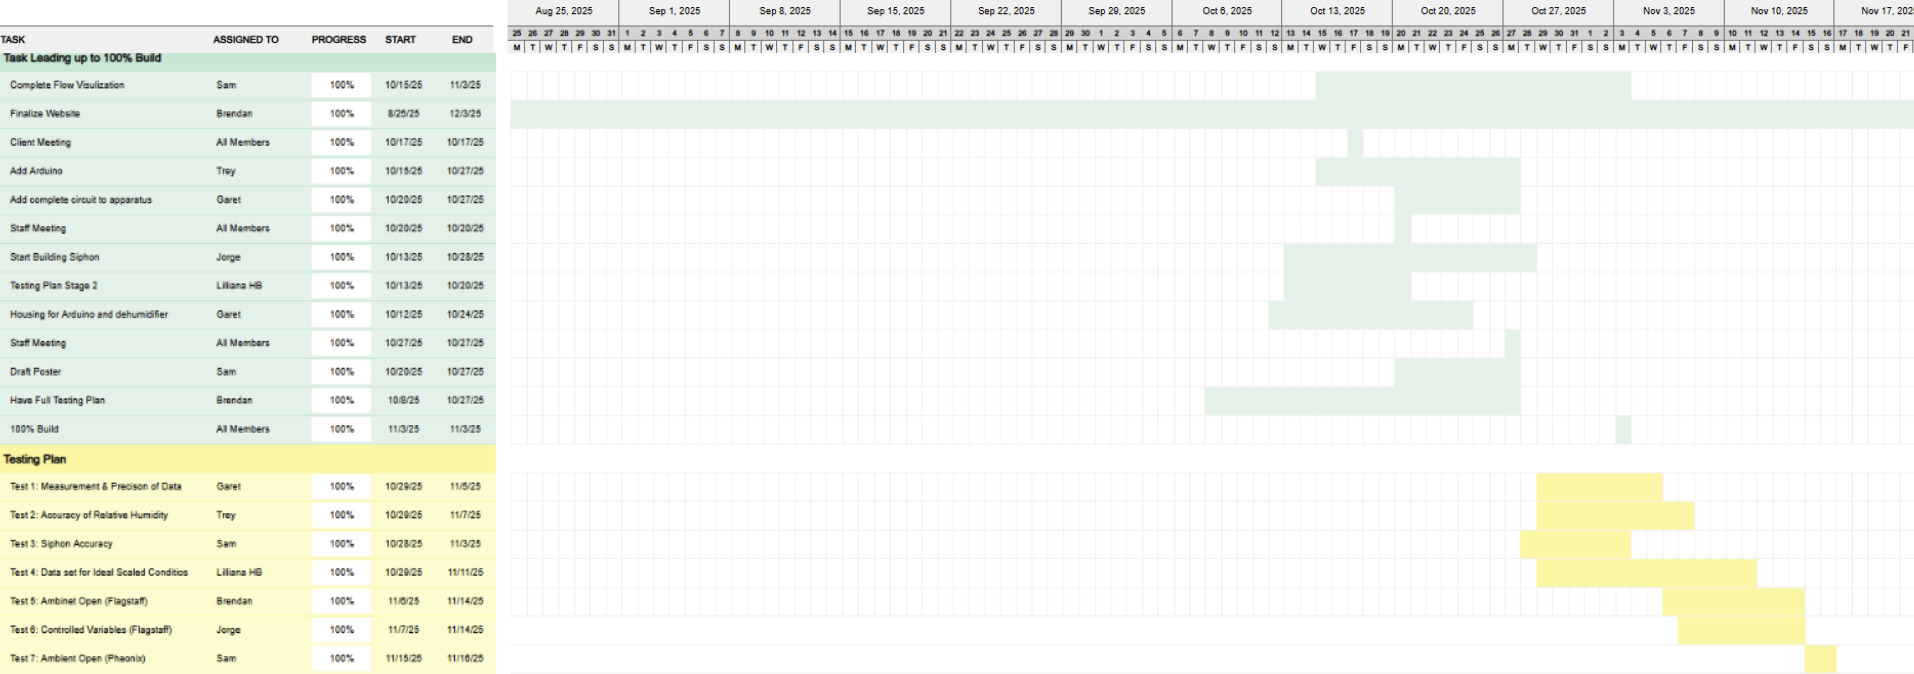
Schedule
Project Timeline
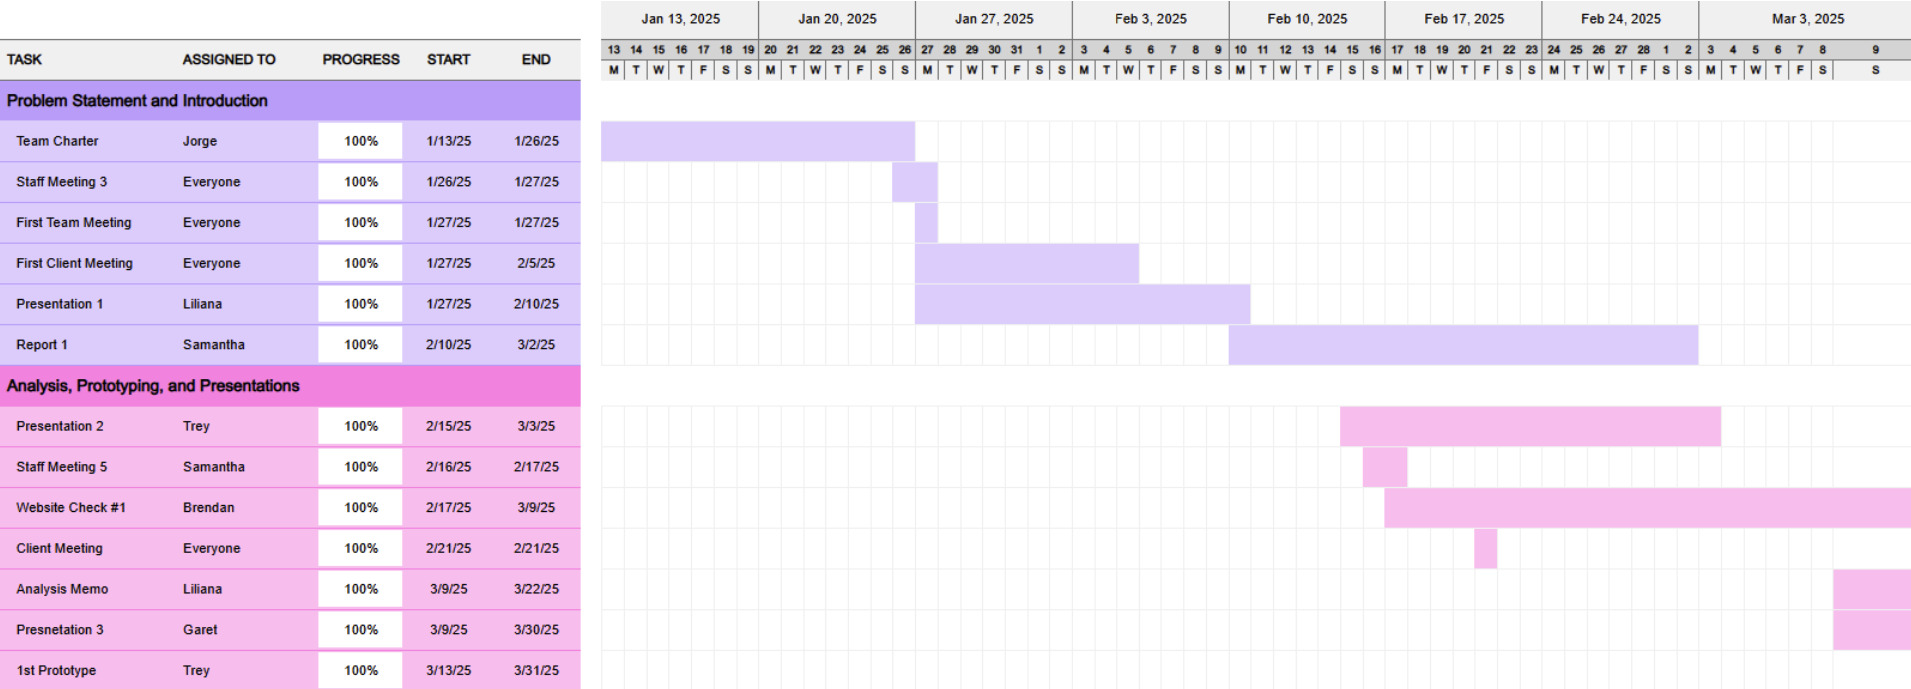
The project will be completed over a 9-month period from September 2024 to May 2025, following these submittals:
- Team Charter : Establishes our shared goals, expectations, and responsibilities so the team starts aligned.
- Presentation 1: Prototype design and lab testing
- Report 1: Field testing and data collection
- Presentation 2: Shares updates on progress, pivots, and next steps in a clear, visual format.
- Website Check #1 : First review of our project website to ensure it accurately reflects our progress and design.
- Analysis Memo : Summarizes our technical evaluations or simulations and justifies design decisions.
- Presentation 3 : A refined overview of our design and prototype work, preparing for client and faculty input.
- 1st Prototype : The first physical build of our system, used to test design assumptions and gather feedback.
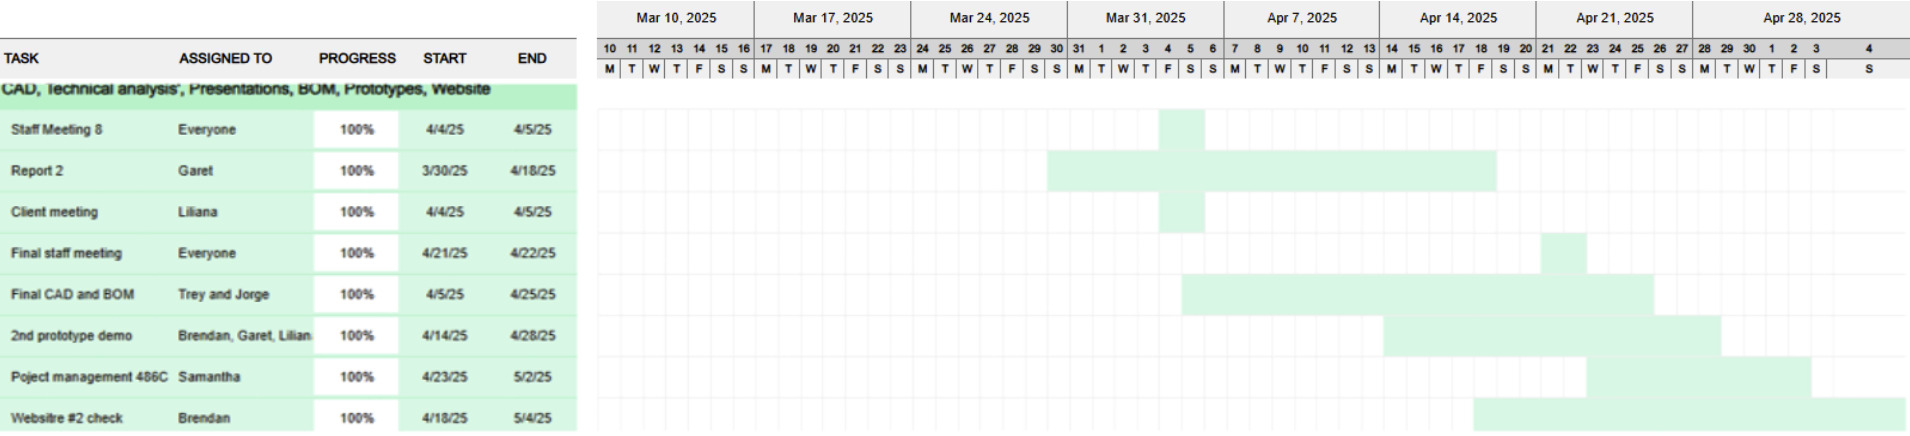
- Report 2 : A second comprehensive document updating all technical progress and outcomes since the first report.
- Final CAD and BOM: Complete 3D models and the bill of materials needed for final production or evaluation.
- 2nd Protoype Demo: Demonstration of the improved version of our system, highlighting changes and results.
- Project Management 486C: Administrative and planning documentation to meet course-specific requirements.
- Website #2 Check : Final review of our website to ensure it's complete and professional for public or sponsor viewing.
- Project Management : Ongoing coordination of tasks, deadlines, documentation, and team communication.
- Engineering Calcs : Detailed calculations validating the design's performance, efficiency, or safety.
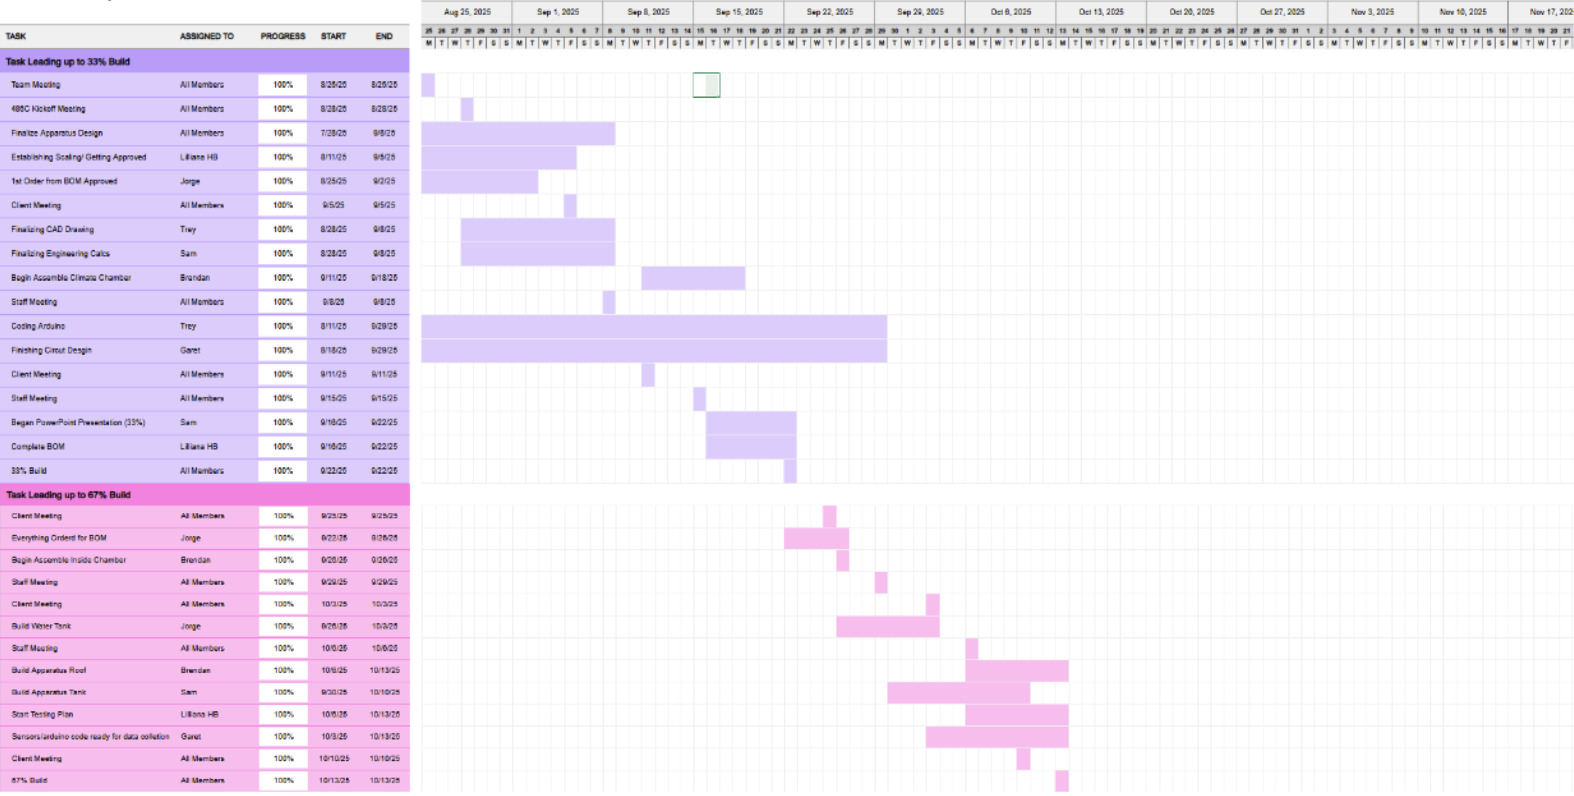
- Hardware Status Update 33% Build : Shows that we’ve completed one-third of our physical system build.
- Hardware Status Update 67% : Indicates that we're over halfway finished with hardware and ready to begin integration.
- Draft Poster and Finalized Testing Plan : Creates a visual summary of our project and outlines how we’ll validate its performance.
- Hardware Status Update 100% : Marks that the system build is complete and ready for full testing or handoff.
- Final Poster Submission & PPT : Submits our final visual presentation materials for the symposium or project showcase.
- Initial Testing Results Video : Documents how our prototype performs and helps communicate it to stakeholders.
- Final CAD Packet Submission: A full technical package of our design including drawings and references for future use.
- Product Demo & Testing Results : Showcases how well the system works and explains any limitations or discoveries.
- Final Report & Final Website Check : Wraps up the entire project into one polished document and verifies the website’s final state.
- Client Handoff : Transfers all relevant materials and documentation to the client or sponsor, ensuring they can continue independently.
- Symposium Presentation : Publicly presents the project in a final showcase to peers, faculty, and possibly industry professionals.
First half of Spring Semester timeline.
2nd half of Spring Semester timeline.
First half of Fall Semester timeline
2nd half of Fall Semester timeline.
Budget
Budget Allocation
The $5,765 budget is allocated across these primary categories including the $765 from fundraising:
- Construction & Materials: ~ $3000
- Testing Equipment: ~ $500
- Transportation to Phoenix: ~ $1500
- Gas Utilized: ~ $200
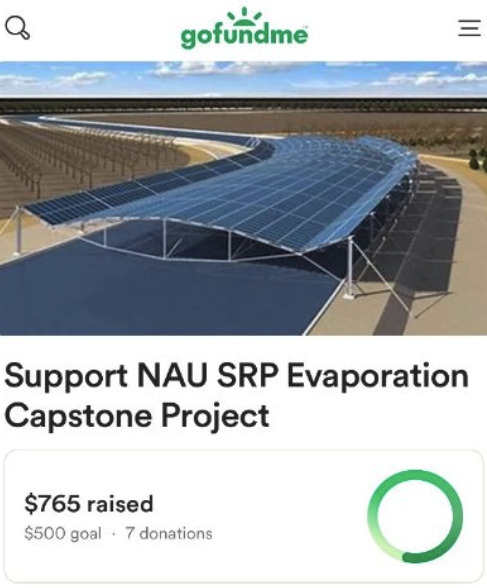
Additional fundraising earned through GoFundMe
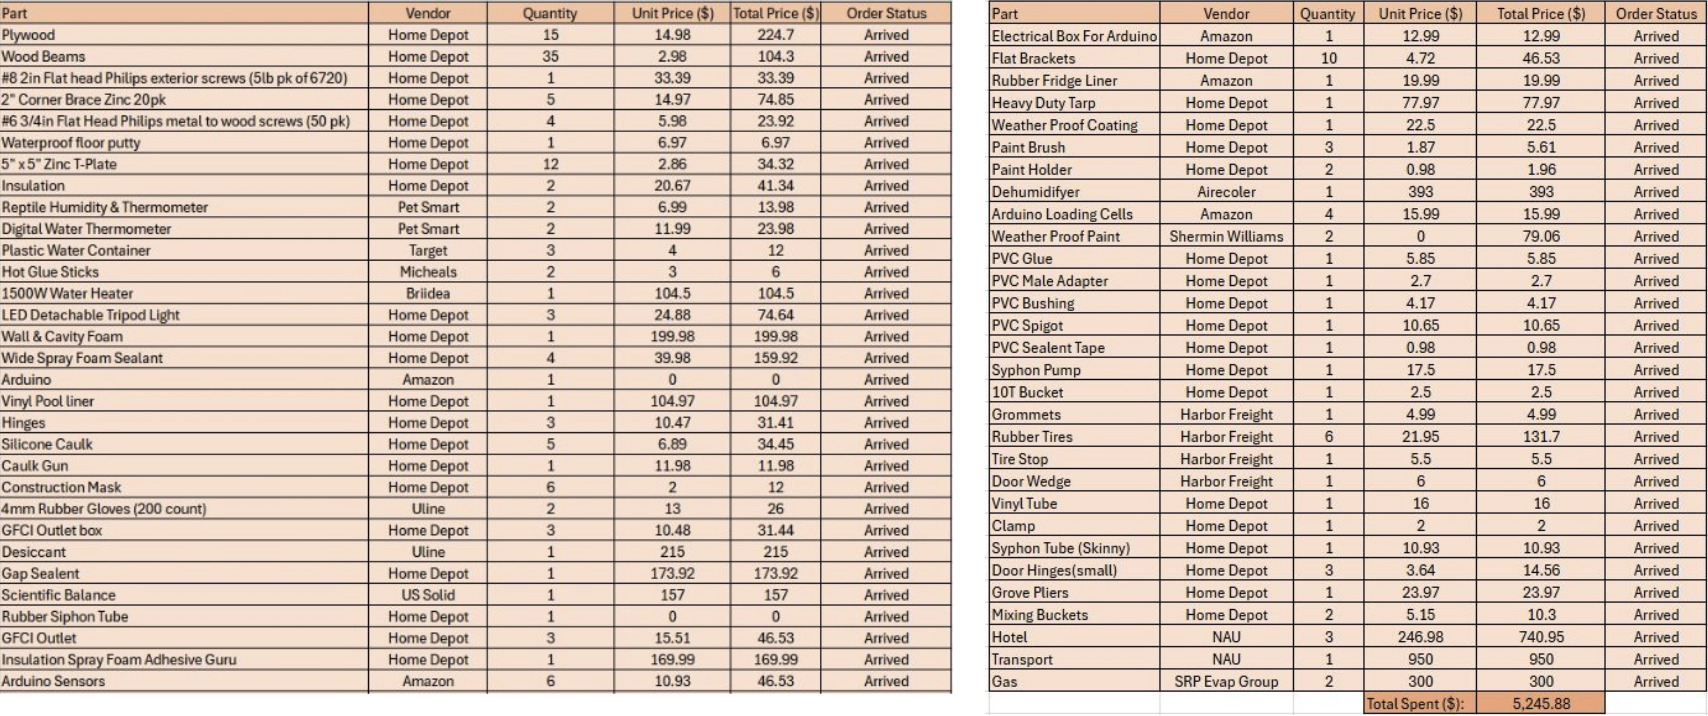
Visual breakdown of project Bill of Materials
Concept Evaluation
Evaluated Concepts
At the beginning of the project in Spring 2025, our team started by framing the problem around a forced-convection setup. We expected that by creating controlled airflow across the water surface, we could better manage the boundary conditions and measure evaporation in a repeatable way. With that goal in mind, our early concept generation focused on four main components: how large the apparatus needed to be, how we would measure temperature, how we would measure humidity, and how we would capture wind speed at several locations along the canal. All of these factors were essential for defining the thermal and velocity boundary layers needed to calculate the convective heat-transfer coefficient for forced convection, so we spent considerable time evaluating how each part would integrate into the overall system.
1. Climate Controlled System
Physical apparatus that allows the team to directly controll wind speed, temperature, and humidity.
2. Field Experiment
Tests ran in Flagstaff conditions as well as Phoenix conditions to share and compare data with ASU.
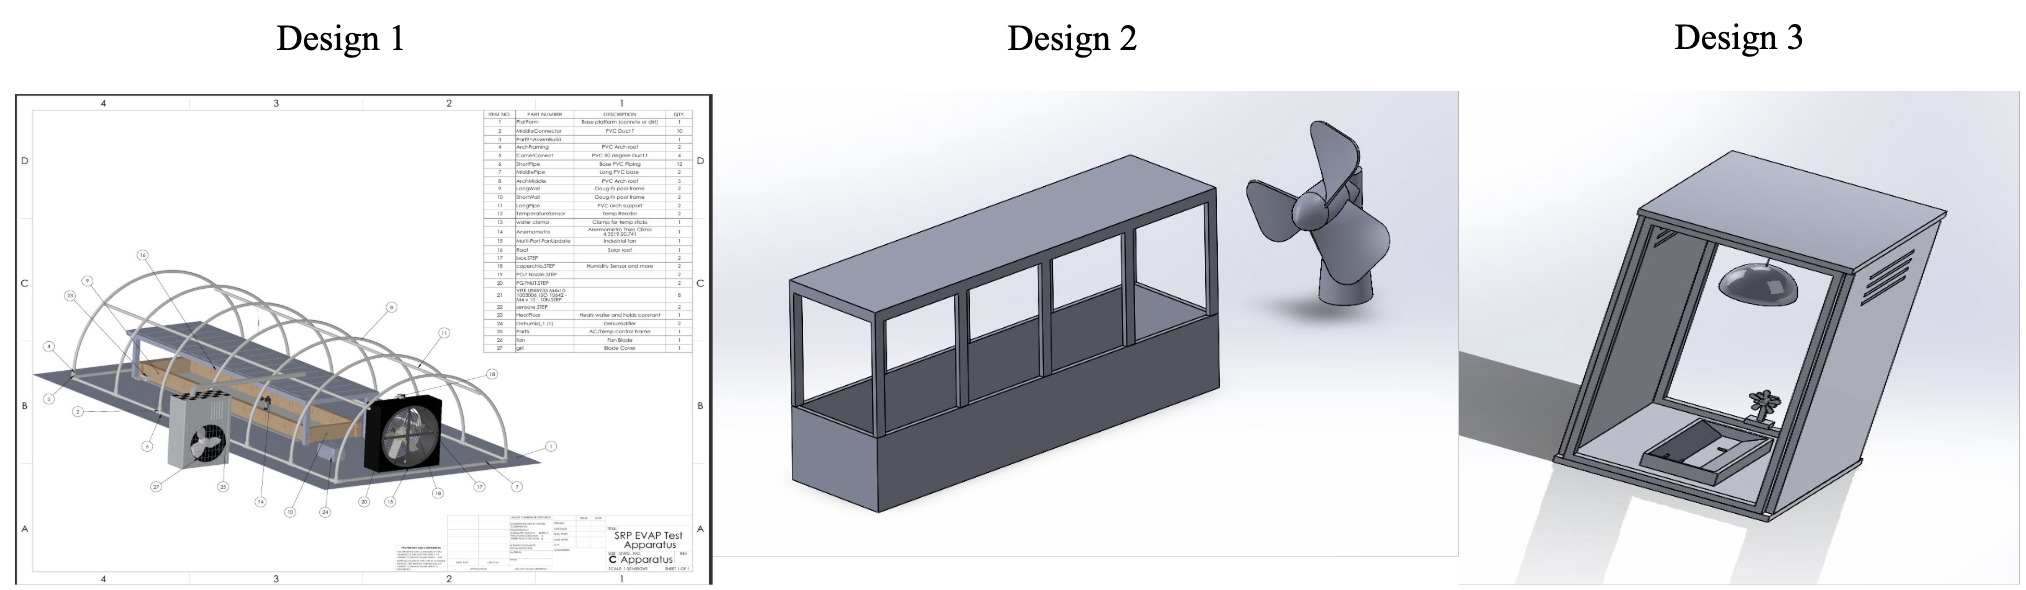
The three prototypes based off the above criteria.
Selected Approach
After extensive mathematical modeling, we selected a revised concept 1, based off the Pugh Chart below. This allows the team to directly controll what variables are being tested to define our mass transfer coefficient.
Final Design
Selected Solution
As the project transitioned from Spring (forced convection focus) to Fall (natural convection focus), the design approach shifted toward achieving controllable buoyancy driven flow rather than mechanically induced airflow. Early concepts involving fans and wind tunnels were removed to avoid disturbing the boundary layer that drives evaporation. Instead, the team redesigned the apparatus to emphasize insulation, passive temperature control, humidity regulation, and canal like geometry to replicate Rayleigh scaling. This led to the selection of a sealed wooden frame with integrated heating/cooling, dehumidification, and a sensor network that could operate for multiple hours without external disturbances. The Fall concept prioritizes scientific accuracy, stability, and simplicity over complexity or portability.
- Precision length and width of water tank to match canal 1:5
- High walls to reduce enviormental factors
- Fully insulated Apparatus to recude heat transfer from enviorment
- Sufficient Temperature humidity and wind speed sensors
- Modular design adaptable to various reservoir sizes

Our final evaporation reduction system design shown in a reservoir environment
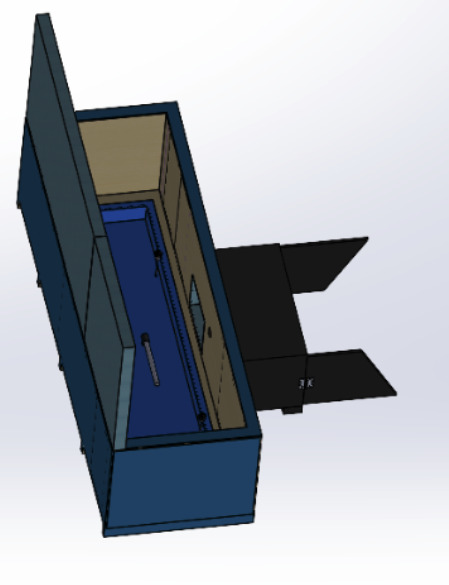
Our final evaporation reduction system design shown in a reservoir environment
Performance Metrics
The tank must protect the water from wind and weather. The water temperature must be controlled and all sensors accurately collecting data. The evaporation rate must be calculated from our data, and ASU recievies viable data for further research.