Project Information
Project Location
Quality Vans and Specialty Vehicles Testing Facility in Tempe, Arizona
Constraints
The project constraints include:
Budget
Staying under the proposed budget of $800.
Fabrication
Waiting for the fabrication of the test box and material samples before being able to begin testing.
Testing
Locating a suitable testing location for the flammability testing.
Critical Failures
Material melting
Adiabatic Combustion
Combustion Modeling with Species
Burn Box Integrity
Design: Computational Fluid Dynamics
Due to the nature of the project in place of designing, flammability testing is being conducted. Before testing occurs an analysis of the four materials will be conducted. An initial analysis has been done for each of the materials in Solidworks and ANSYS. Each analysis and the test box is shown in the photo gallery. These include:
Thermal Analysis-ANSYS
Combustion Modeling-ANSYS
Combustion Modeling with an Adiabatic Flame-ANSYS
Thermal Analysis
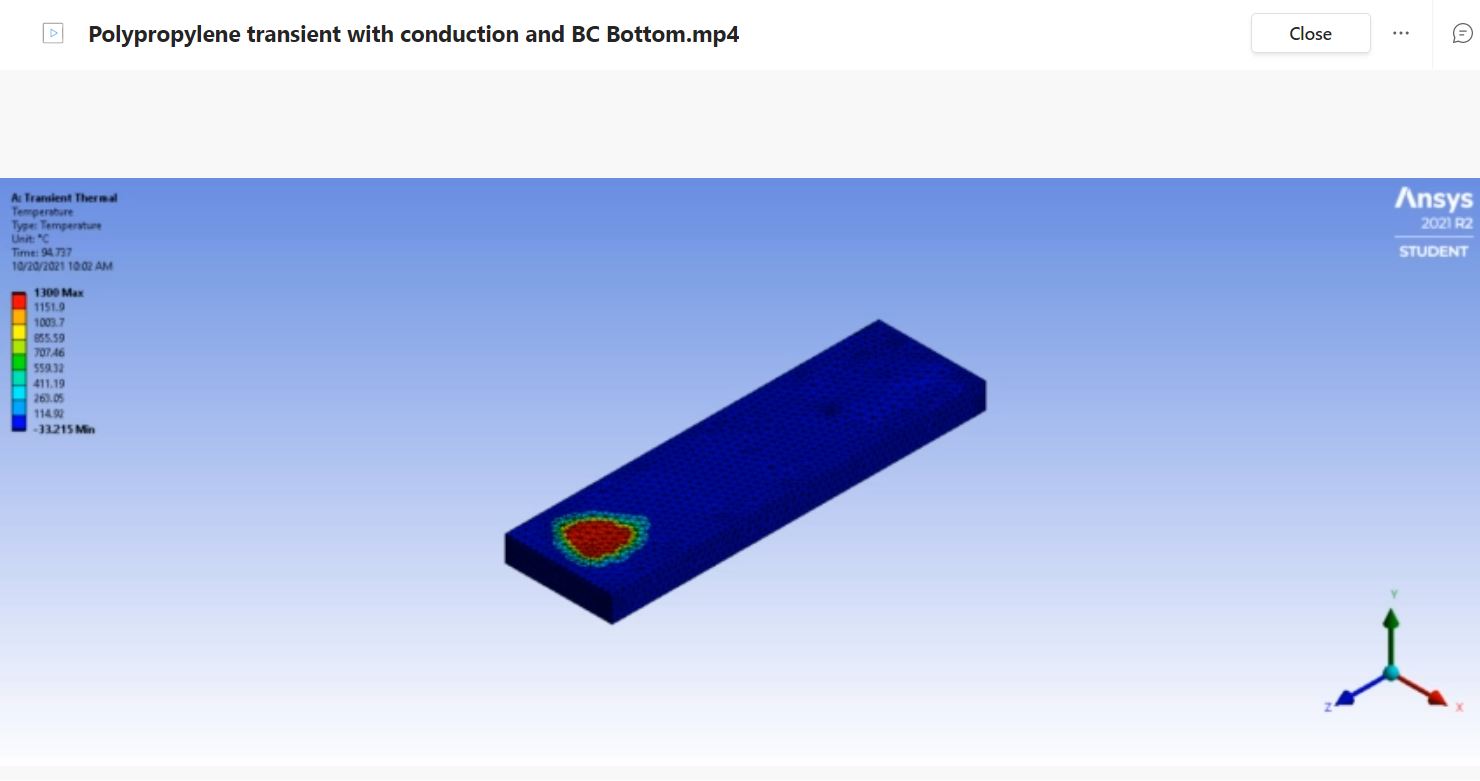
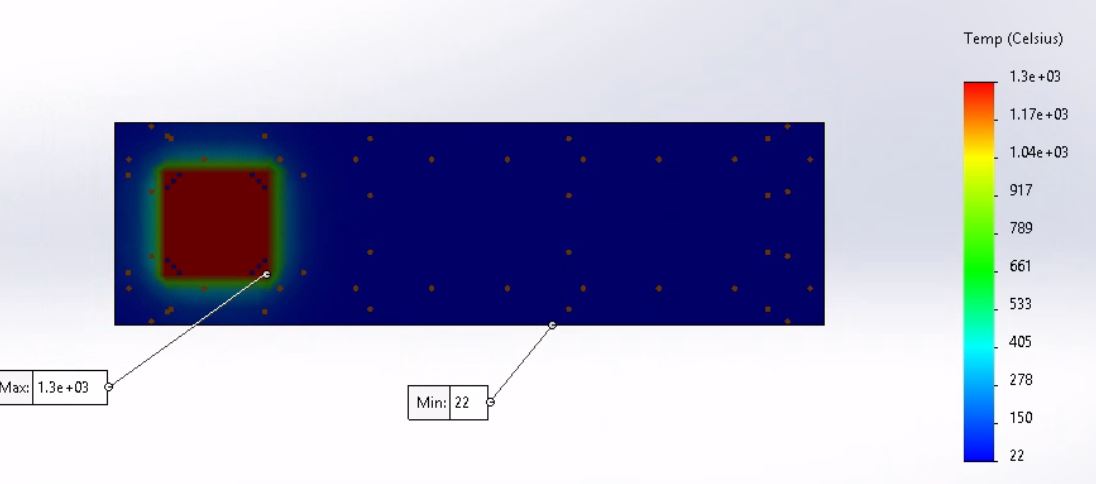
The evaluation of the transient thermal behavior of the material requires a computer-generated model of the material specimen. The testing standard provided by the FMVSS testing procedure states that the material specimen must be 14 inches in length, 4 inches in width, and have a depth of 0.5 inches. In order to simulate the thermal effects, the Bunsen burner has on the material specimen initial parameters and geometric locations were applied. During the physical testing of the materials the testing standard requires the flame of the Bunsen burner to be positioned 1.5 inches from the end of the material and have the base of the flame sit 0.75 inches below the material. In order to simulate this the ANSYS model has a temperature concentration located at 1.5 inches from the leading edge of the material specimen and is also concentrated on the underside of the material. The simulation resulted with a maximum temperature of 1300 degrees Celsius and a minimum temperature of 22 degrees Celsius. The simulation is set to an initial temperature of 22 degrees Celsius to mimic the conditions the physical material will be subjected to a minimum of 10 hours before the testing is set to begin. The maximum temperature of the simulation is set to 1300 degrees Celsius which is the estimated temperature of a Bunsen burner flame at 0.75 inches from the base. The results of these simulations will be shown and discussed below along with links to the simulation videos for further visual aid. More work is necessary to create a true theoretical model of the material response to the contact with the flame with emphasis on implementing values for convection losses, conduction losses, and heat flux values. For this analysis the focus remains on the transient thermal response of the materials over the maximum duration of testing which is 120 seconds or 2 minutes.
The Wilsonart Chemsurf Laminate is not displayed in a simulation due to a processing issue with ANSYS. The transient thermal simulation fails when run with the epoxy resin material in ANSYS and no other material is similar enough to the provided test material to be a viable comparison through simulation. Due to the processing issue with this material, it has been, for the moment, omitted from the simulations until further ANSYS manipulation can be accomplished. For the simulations that are displayed and discussed below a significantly more refined mesh was used compared to the previous presentation of this analysis in order to display a more accurate transient thermal effect on the material specimens.
Combustion Modeling
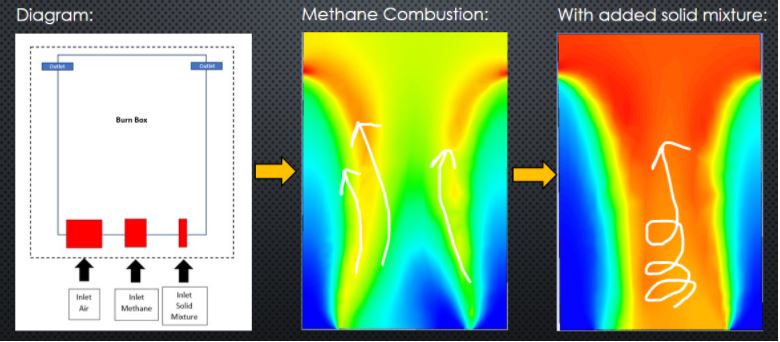
Combustion modeling in ANSYS consists of several ways to develop a model to analyze different simulations. The basis of combustion modeling is CFD (computation fluid dynamics) modeling which has principles of fluid mechanics. In return the simulation illustrates the interactions of liquids and gases where the surfaces are defined by boundary conditions. Moreover, combustion modeling is an important technique in understanding how differently gas mixtures with material will react. Which is all dependent on which fluid flow equations you use, material specs., and the different simulation options. Below are different combustion models of two different materials undergoing a Bunsen burner on the bottom surface. Developing combustion models contributes to becoming a professional engineer by strengthening your knowledge of simulating different scenarios related to fluid, thermal, static, etc. From this analysis we are too able to input timesteps throughout the model to display the different stages of the combustion analysis. In the figures below they show a timestep at thirty seconds and at one-hundred fifty seconds. This helps our team visualize the difference between the two different timesteps and theorize which materials have a higher burn rate. Self-learning combustion modeling will require the student to revert to fluid mechanics. Since combustion is a fluid scenario the next step would be to determine what the gas mixture is when entering the boundaries determined. After inputting the correct functions into ANSYS meshing is another function that is crucial in developing a simulation because this is where the boundaries are made and where the engineer will determine the inlet and outlet inputs. After computing the simulation displaying a contour is the next step in illustrating what you want to be analyzed. Since the illustrations are dependent on what the engineer wants to display ANSYS has made the software easy to navigate to change different settings.
However, before conducting an analysis different species were determined to create an environment that is like what the flammability test will entail. To determine the species our team had to determine the chemical reactions that will occur from the flame (methane and air) and material (by-products). Another data point that will need to be the same is the boundary condition for each system such as the flame rate of the Bunsen burner, air content and material burning. Which are all data needed to determine the burn rate.
Adiabatic Flame
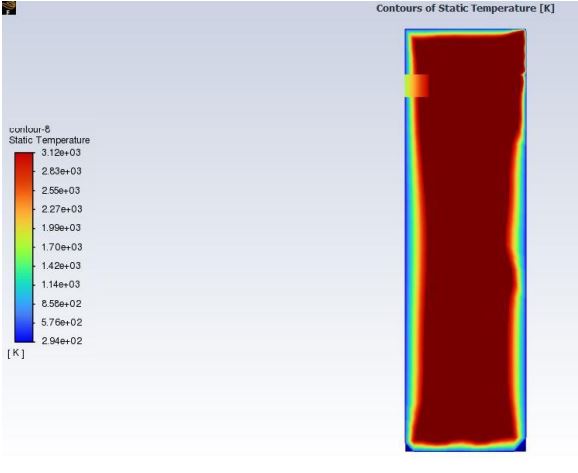
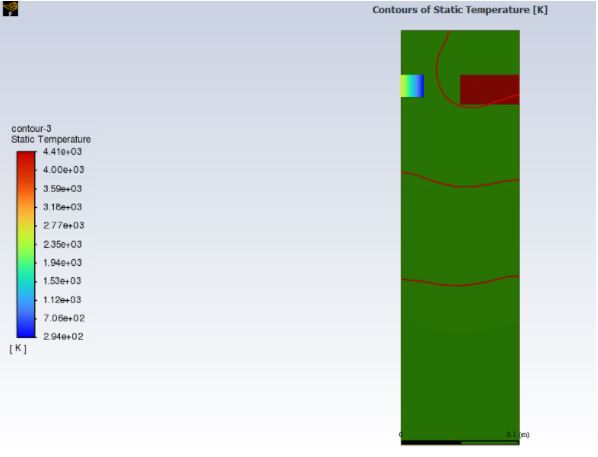
For this analysis I will be taking a different approach to the previous ANSYS modeling by simplifying it and treating it as an adiabatic system. I am currently still completing the physical model but will discuss the calculations needed in order to finish the simulation. Adiabatic is when the combustion has zero heat loss and allows for a more ideal result and the maximum temperature rise. I start by assigning the specified temperature of 1580 degrees kelvin of the methane to the location on the material specified in the testing procedure as the initial conditions. An Adiabatic system is affected by the fuel-air ratio, the initial air temperature which is 70 degrees Fahrenheit as mentioned in the testing procedures, and the fuel type for the Bunsen burner which is methane, and the constant pressures which will be near 1atm for the fuel and air. In order to be able to simulate this in ANSYS I need to solve the adiabatic flame temperature. This process began with an energy rate equation and stoichiometry [6]. The sum of the products equals the sum of the reactants which is methane plus oxygen and nitrogen is equal to carbon dioxide, water vapor, and nitrogen. By balancing the chemical equation and then taking the sum of the enthalpies I was able to solve the temperature exiting after combustion. The temperature of the oxide enters in at around 1580 Kelvin goes to 293K from the initial temperature that the box will be kept at and then exits after the combustion at the calculated value of 3115 Kelvin. Which again is the value of the output once the combustion occurs. By applying these values along with the properties of the materials of fiberglass and melamine resin the simulations are completed as seen in figure 2. The red portion of the figure is the point of contact set to the adiabatic flame temperature of 3115 kelvin. The outlet is the various color portion and shows the release of the reactants. The rest of the material increases in temperature but does not show a failure of a constant flame temperature. The results present the material does pass the simulation.
CAD
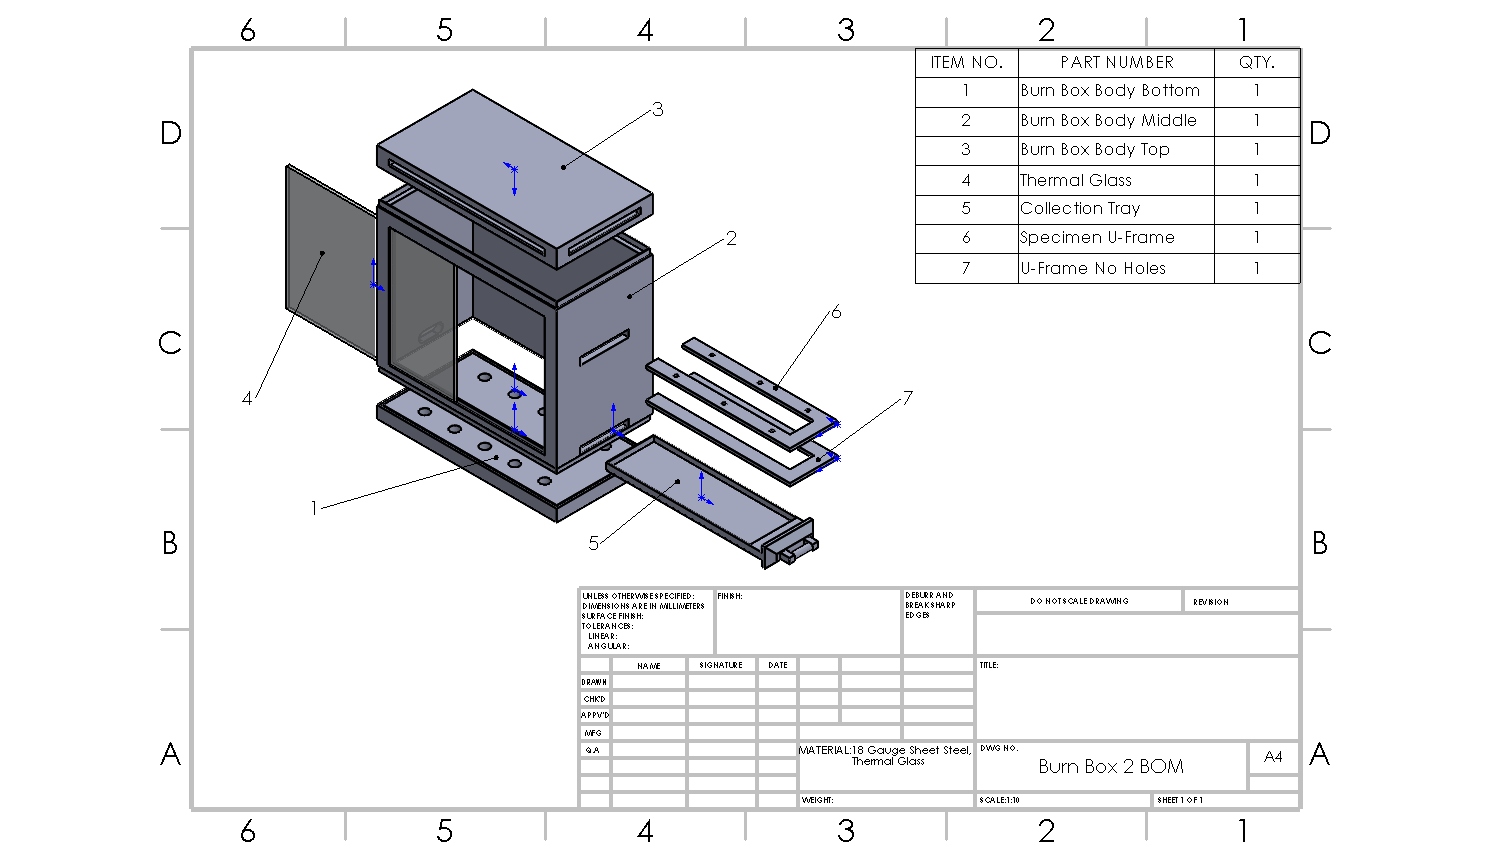
A design of the flammability test box was dimensioned and created in Solidworks. Based on given guidelines for testing standards a burn box was dimensioned and tolerance within Solidworks. The burn box will be manufactured to use for the flammability testing.
Design
There is still only a single, regulated testing box that is needed to perform the tests as outlined by the National Highway Traffic Safety Administration, U.S. Department of Transportation Laboratory Test Procedure FMVSS 302 manuals. The outline given for the Burn Box in the NHTSA testing procedures are limited as to allow for additions to the box but there are still specifications that must be met or scaled accordingly. For the first box designed, the overall dimensions are in inches and are 15 by 8 by 14 for their width, depth, and height, respectively. There needs to be four, 3/8-inch legs on the four corners to allow for ventilation from the interior holes out through the bottom. There are two rows of holes that are 2.5 inches apart from each other, 1.5 inches away from either side of the box and the rows are spaced 5 inches apart. The holes have a ¾-inch diameter. On the front of the box there needs to be a pane of heat resistant glass 13 inches wide for observation. On the side, there needs to be an access door that is 6 inches wide. At the top of each of the faces of the box there have to be half inch vents, 13 inches wide on the 15-inch faces and 6 inches on the 8-inch faces. The UFrame, for holding the material while testing, dimensions were also given in inches. The sideways, rights side open U is to be 12 inches wide with each prong being 1 inch thick with a 2-inch gap between the closest sides. The connecting portion of the UFrame is also 1-inch thick. There are six holes, three on each side for securing materials between the top U-Frame and the bottom U-Frame. This can be done either by piercing the material and securing them to spikes in the bottom of the two U-Frames and then being pressed together or threading the holes in the top U-Frame and using something similar to an eye tab bolt to hold the material with downward pressure.
