
Please scroll down to read more details.
Your personal asphalt road guard.
Thanks for your visiting!
Bike Star Team
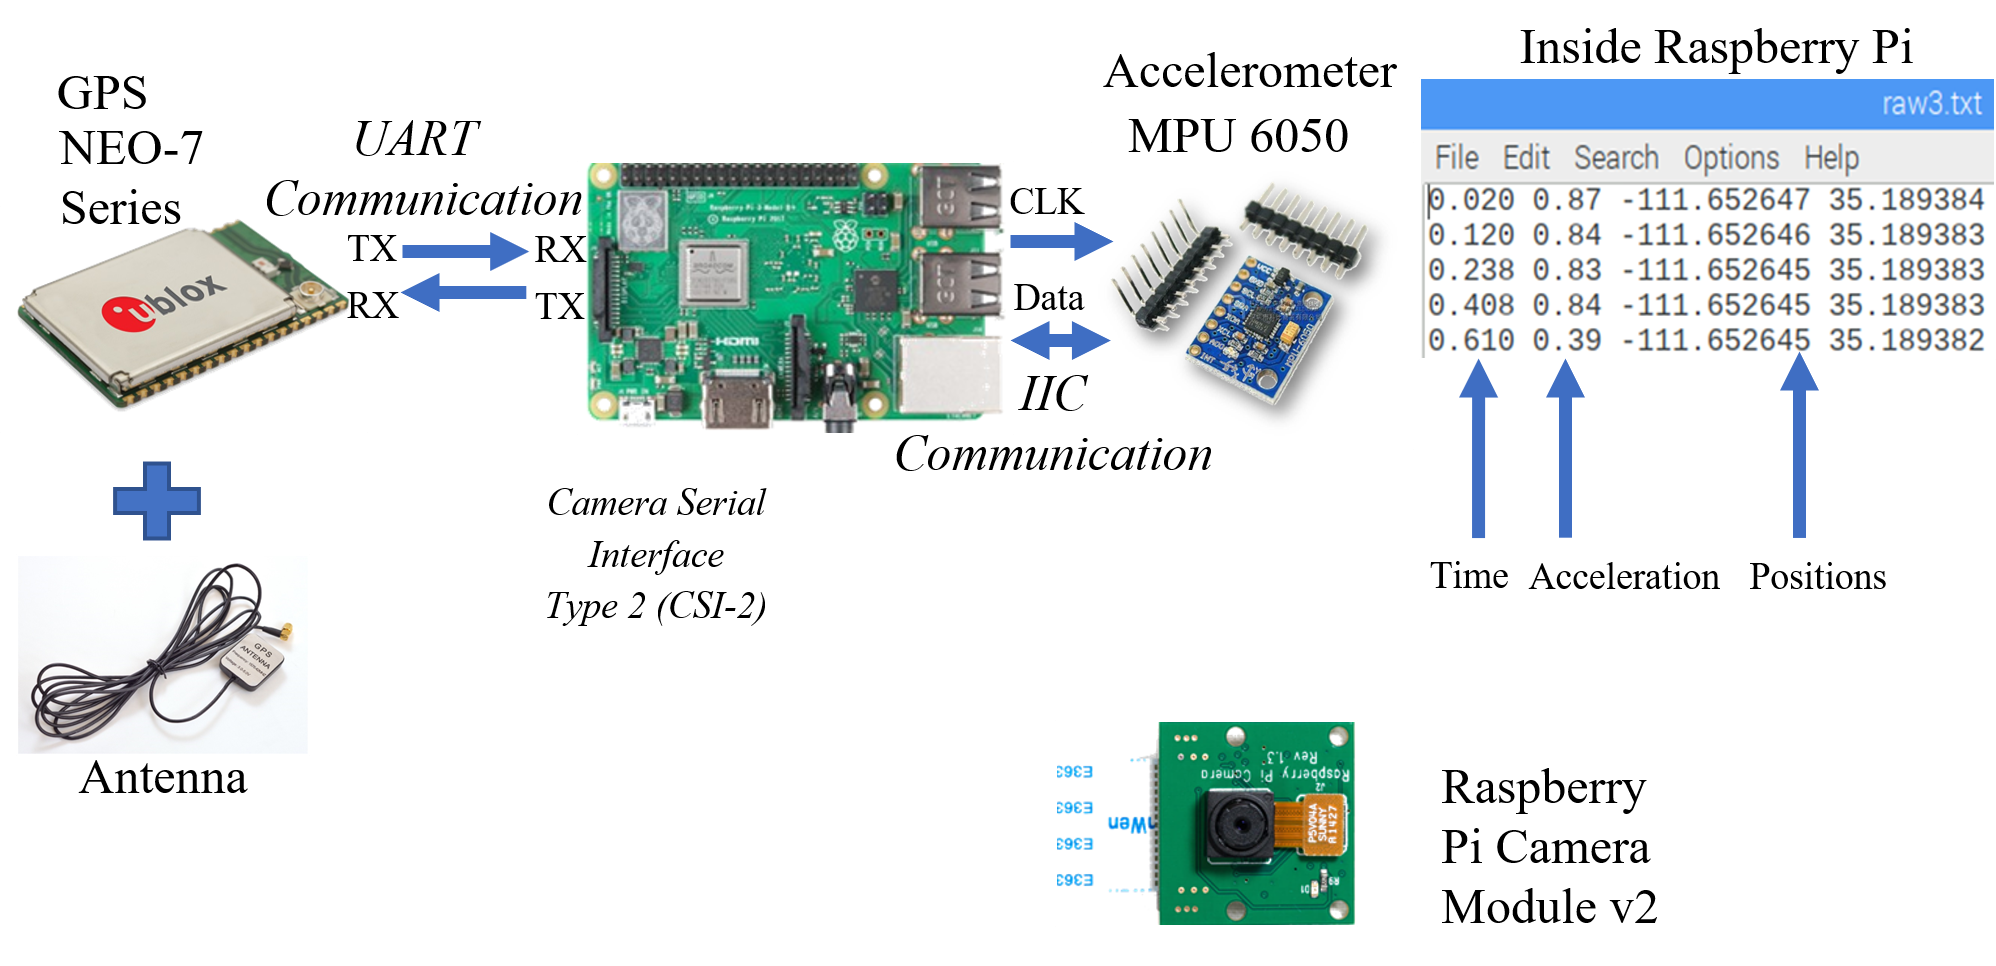
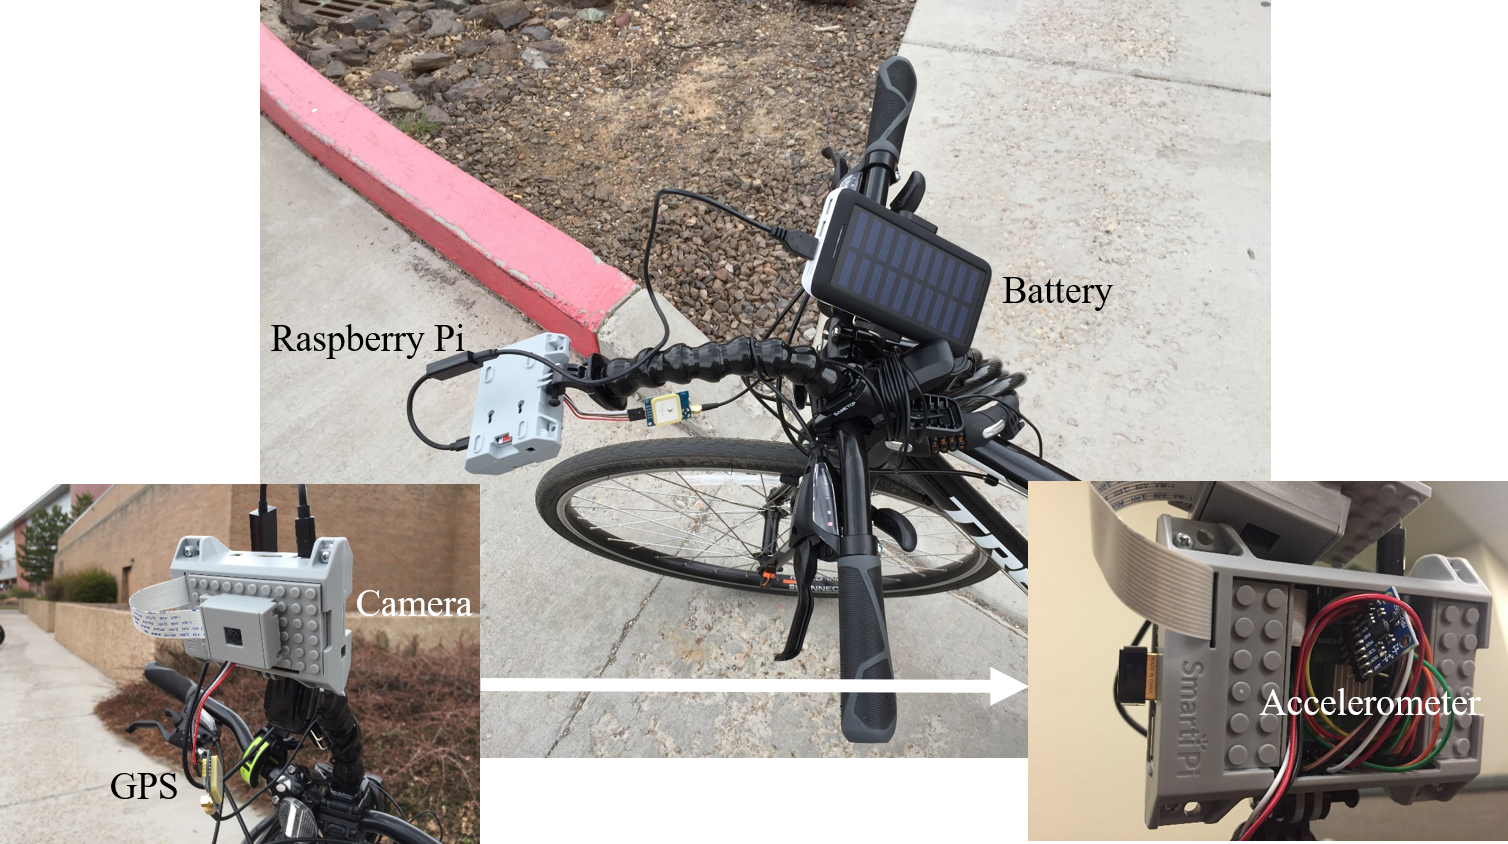
For the data logger part, the GPS is called NEO-7, and it connects an external antenna to enhance its signal strength. The NEO-7 GPS module has better accuracy, and the GPS frequency can be changed through Ublox GPS configuration tool on Windows based on Raspberry Pi.
Also, our system uses MPU6050 as the accelerometer, which is precise in measuring accelerating values. Through IIC communication protocol the Raspberry Pi can read data from the accelerometer, and later the system will utilize these data.
Besides, we applied the Raspberry Pi official camera, which shoots videos with a high number of frames and good resolution.Through the camera serial interface type 2 protocol the system record and analyze the videos.
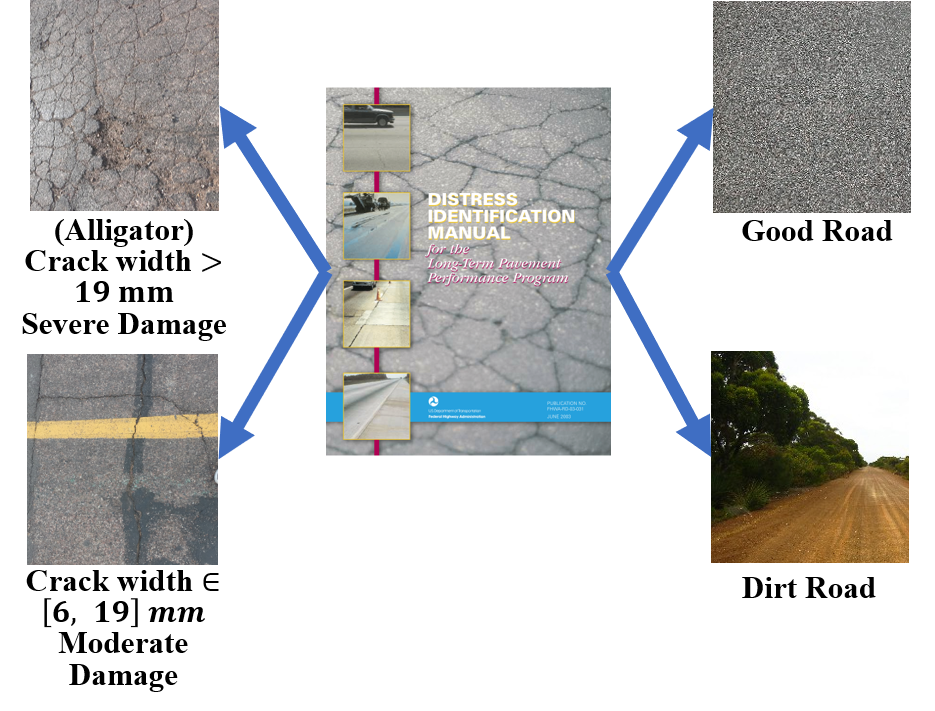
In the data processing, we applied a deep learning technique with TensorFlow to label images extracted from videos. To precisely label images, we first collected pictures of roads around the campus and label them manually according to the Identification Manual published by the department of transportation. If the width of the crack is within 6 and 19 mm, it is classified into moderately damaged type, and if the crack width is larger than 19 mm, it is classified into the severely damaged road.
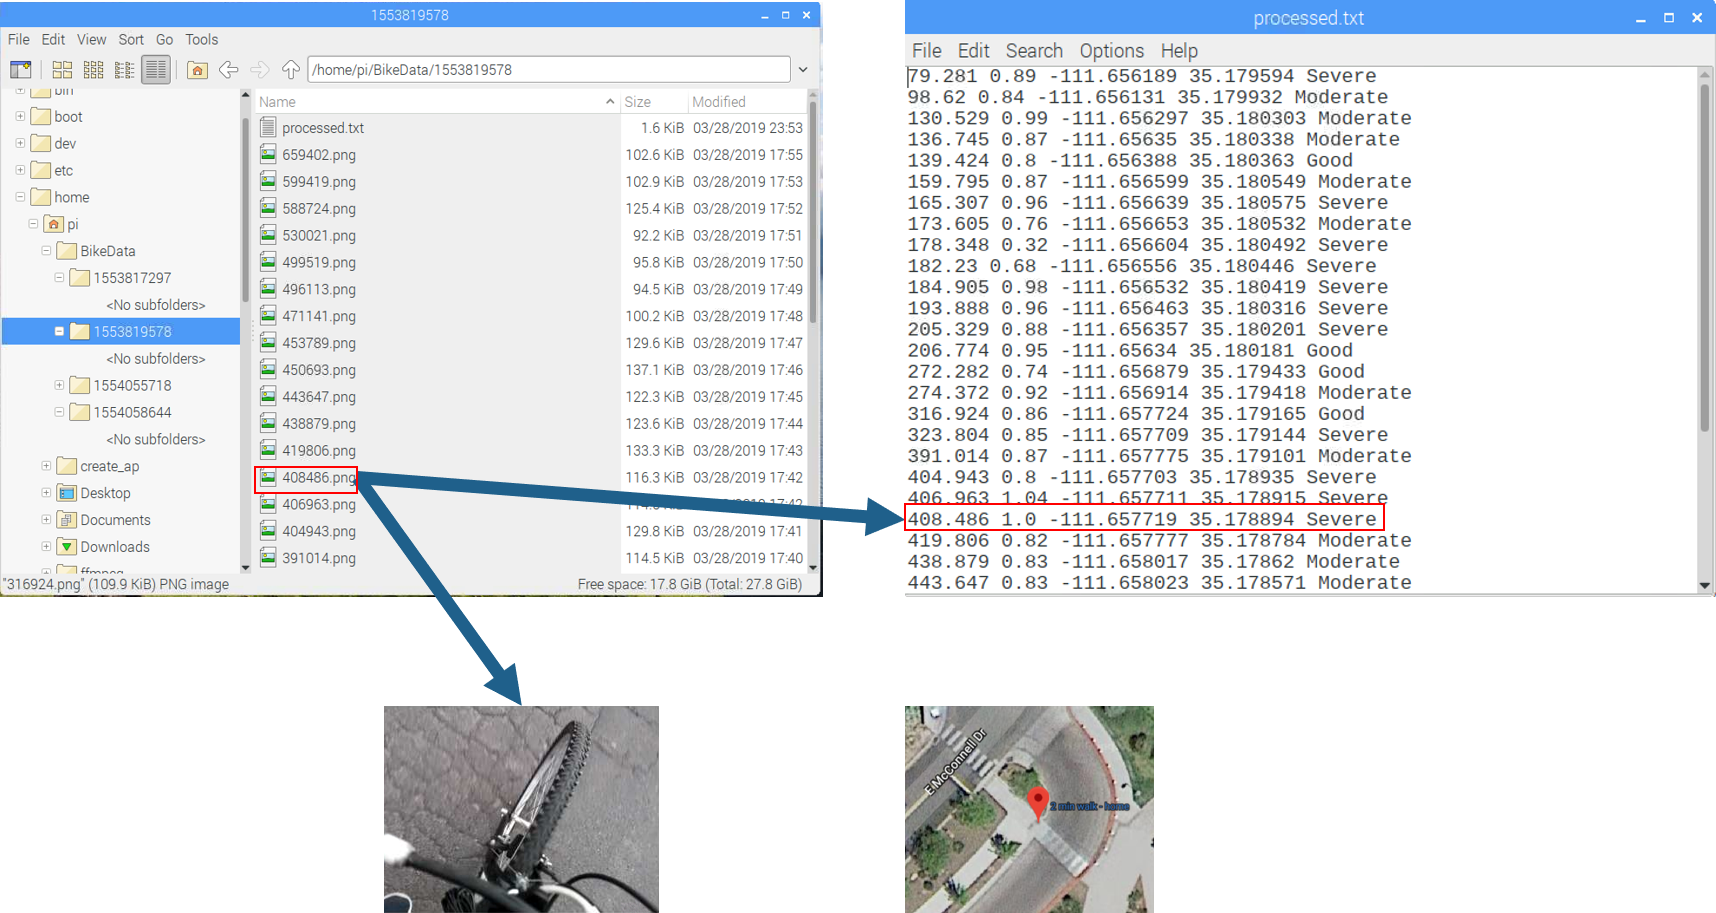
Since the collected dataset is relatively small, we applied transfer learning, which is to retrain a pretrained neural network using the dataset we collected. Note that the pretrained neural network in our design is MobilenetV1. Also, the neural network is wrapped up with TensorFlow which optimizes the calculation on embedded devices so that the Raspberry Pi will not crash when it labels images. After getting the retrained neural network, the program has to find out the accelerating peaks according to our peak detection algorithm, then it will extract images at the time of the peaks. Finally, the program will label images in less than one second for each. Then, all the labeled images are renamed with a time stamp and the picture below shows an example of a severely damaged road in our test, which is near the Social behavior Science bus station.
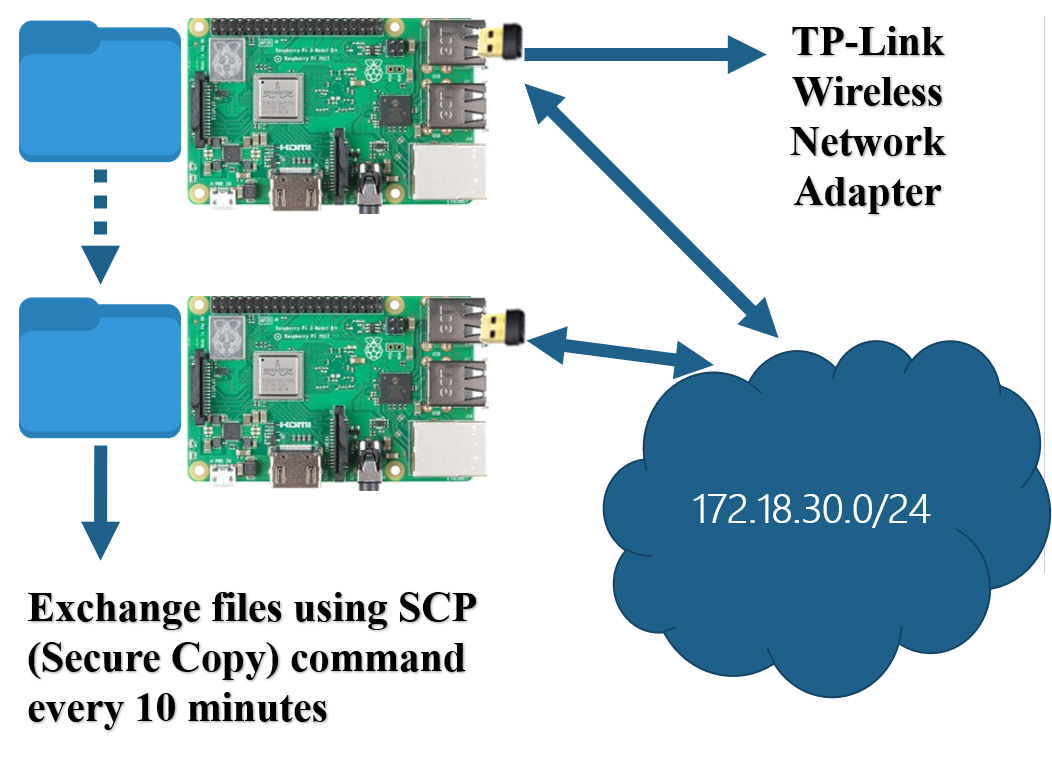
To share the database between users, we choose Wi-Fi mesh as the scheme. Specifically, this kind of network is called Ad Hoc. Based on this design, even in the condition without Wi-Fi signals, users can share their collected data through the intranet.
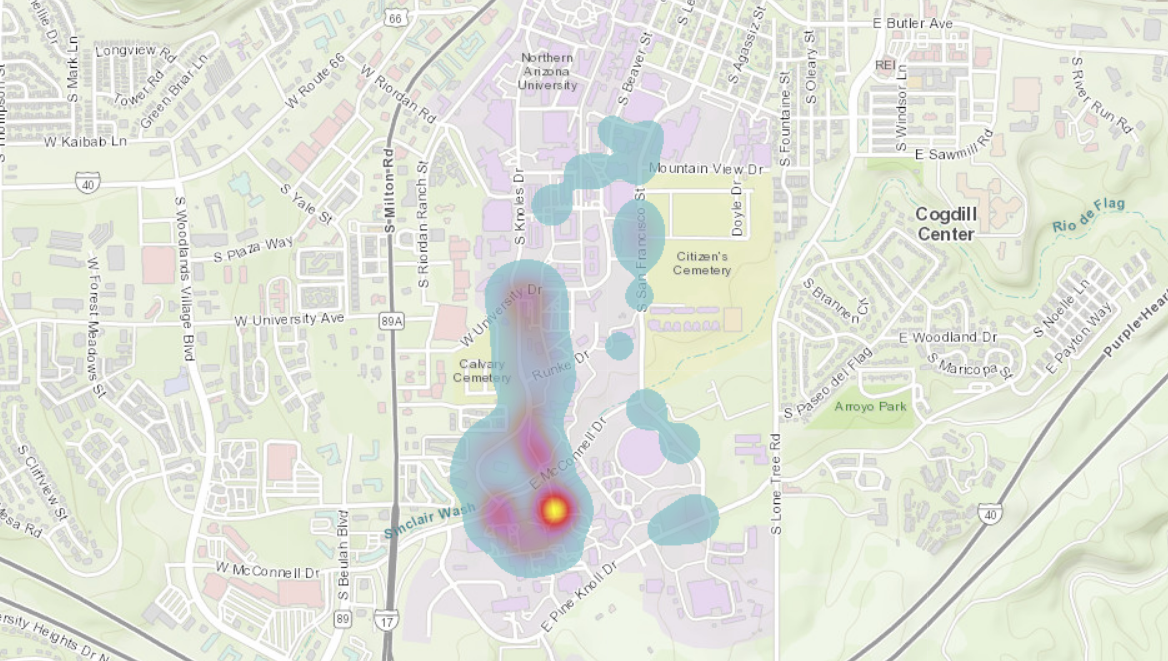
Also, in order to save the memory space of the mobile phone, the user can upload the collected data to the cloud. And the implementation of this technology is based on ArcGIS. With ArcGIS, users can also directly see other people’s data showing online. Also, all the data can be visualized in the form of a heat map for further analysis. A test map is shown below.

We used an Android app to build up the connection with the device and assist users to do analysis on smartphones. Our app consists of three main interfaces, including main interface, setting interface, and the toolbar. The Android app and the Raspberry Pi build up handshake via TCP control to achieve data sharing. During the recycling, a user has to make sure both the Raspberry Pi and the Android app are in the same network. Users can connect to the hotspot of the Raspberry Pi or the Wi-Fi if it is fully covered and stable outside. After that, a user can do analysis on the Android app. Additionally, our wear app is based on Bluetooth for the underlying link, which is similar to the phone app, and the basic function is to show the location. The reason why we don’t choose the IOS operation system is that accessing files in the phone is limited and it is difficult to publish a new application because of the strict policies from Apple, thus we choose Android as our developing platform.
To use our app, first, open the BikeStar app and scan the QR code, which is attached to the outside of our device. Then, tap the start button located in the toolbar category. After that, click “Analyze” in the toolbar to do analysis. Next, go to “Settings” on the entry page and tap the “Update” button, and you can also delete useless files there. Besides, you can tap the offline map button in the toolbar to enter the map with pictures and location. Similarly, you can tap the line chart button to get the information of road bumps. Last, you can tap the watch button in the toolbar to confirm the operation on the watch to open the offline map and show locations with road conditions.
Till now, our devices can be put into use, and the system is very powerful and useful in everyday life. For professional civil engineers, they can use the collected road conditions in their research to analyze which area is more likely to be damaged. For the department of transportation, they can apply our devices to detect where the road needs to be repaired with a low cost and a convenient way.