 PReSto Visualization Application
 PReSto Visualization Application
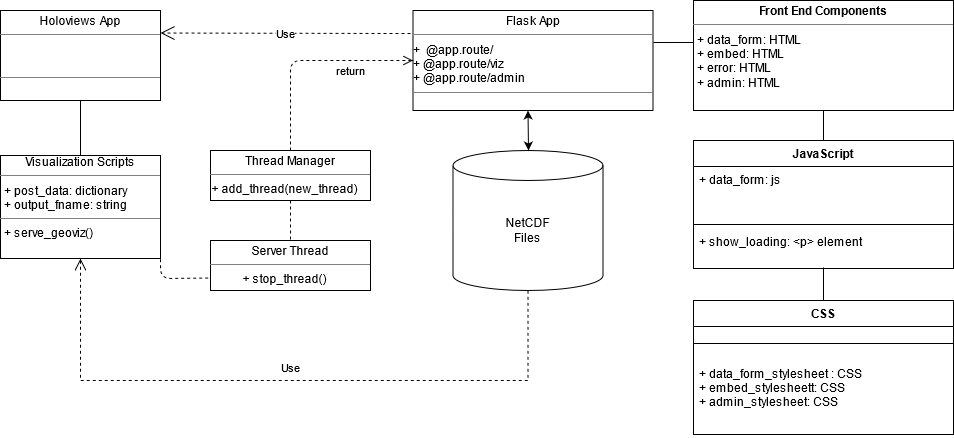
Our web application is served from a simplified Flask back-end. Users will then choose which dataset they would like to be visualized which is stored and posted through an HTML form. Once the required information is received by the server, the required file will be retrieved and passed to a python parsing script that will retrieve the necessary data from the file and produce the visualization (either a geospatial visualization or a time series plot). In the case of a geospatial visualization, a standalone, threaded bokeh server is generated in order to provide interactibility to generated geospatial visualizations. These servers are controlled by a background process that ensures servers are not too numerous or obsolete. Once the plot is generated, it is then added to the generated web page and displayed to the user when served to their web browser. Then, the user can interact directly with their generated visual. See Figure 1 below.
