Project Description

Our project, Lightcurve Modeling of Binary systems, allows astronomers to create and check theoretical models of asteroid systems. Our project focuses on being able to take binary systems in the Kuiper belt and predict a lightcurve. The predicted light curve is compared against an observed lightcurve inside a minimization routine. The minimization routine fits parameters to create a realistic model. Modeling a binary system presents unique challenges that our software solves in novel ways, bringing a sophistication to lightcurve modeling that is not available from any other software.

While our project is geared towards binary systems, the code base itself is robust and can function as an astronomical graphics framework. Our clients will use our solution to examine binary systems in the Kuiper belt to gain a greater understanding of early solar system formations.


What Our Software Does

In October of 2018 we sat down with our clients and figured out what they needed. We took a look at what software they were currently using and found the areas that were lacking. We used their requirements to determine the priorities of our software. Our software solution is a C++ API that meets the following specifications:

  • Produce a light curve in one function call
  • Efficient Ray Tracing to lower run times
  • Render an image of the binary system
  • Reads in Ephemeris Files
  • Runs on Linux and Windows operating systems


Our Solution

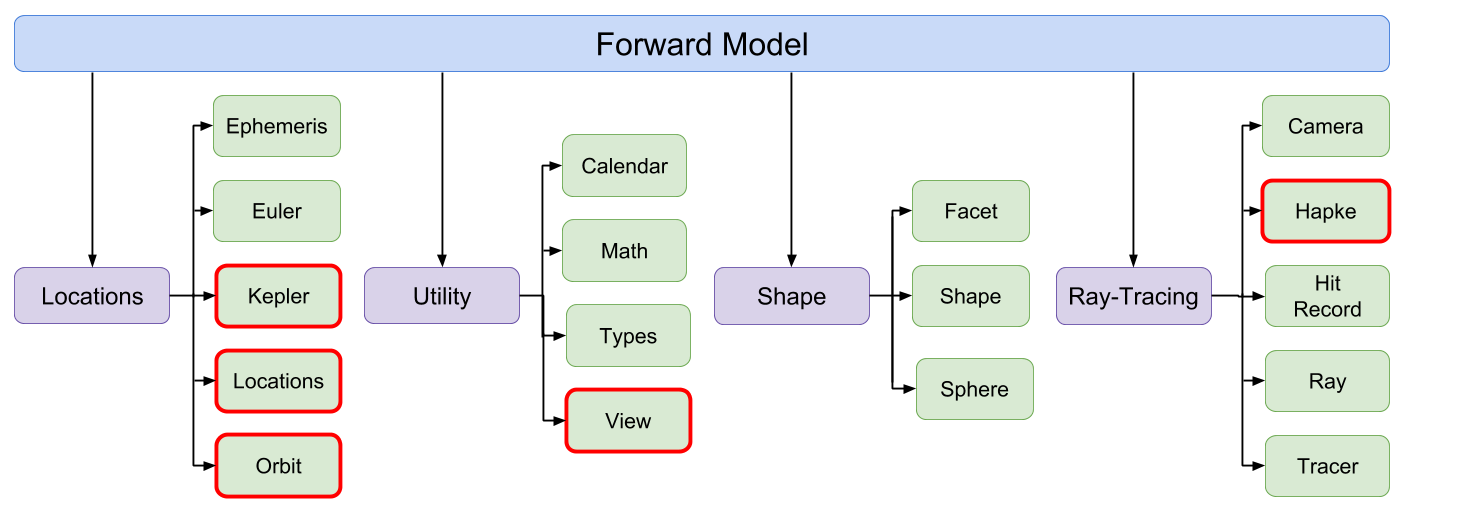
Our C++ API is highly modular and allows for easy development and expansion. The design of our software is comprised of 4 main modules and 17 sub modules. All of the functionality of the software is encapsulated inside the forward model. The forward model uses all of the modules for each function call. The submodules highlighted in red below contain formulas that were given to our team by our clients. Those specific submodules use math specific to astronomers and have been tested for accuracy.
Our software solution can be used to render a set of images. These sets of images can be stitched together to create a movie (see below). This lets users see exactly how the software is rendering the scene. This is useful for checking work to make sure everything is inputted correctly and also for presenting work to others.
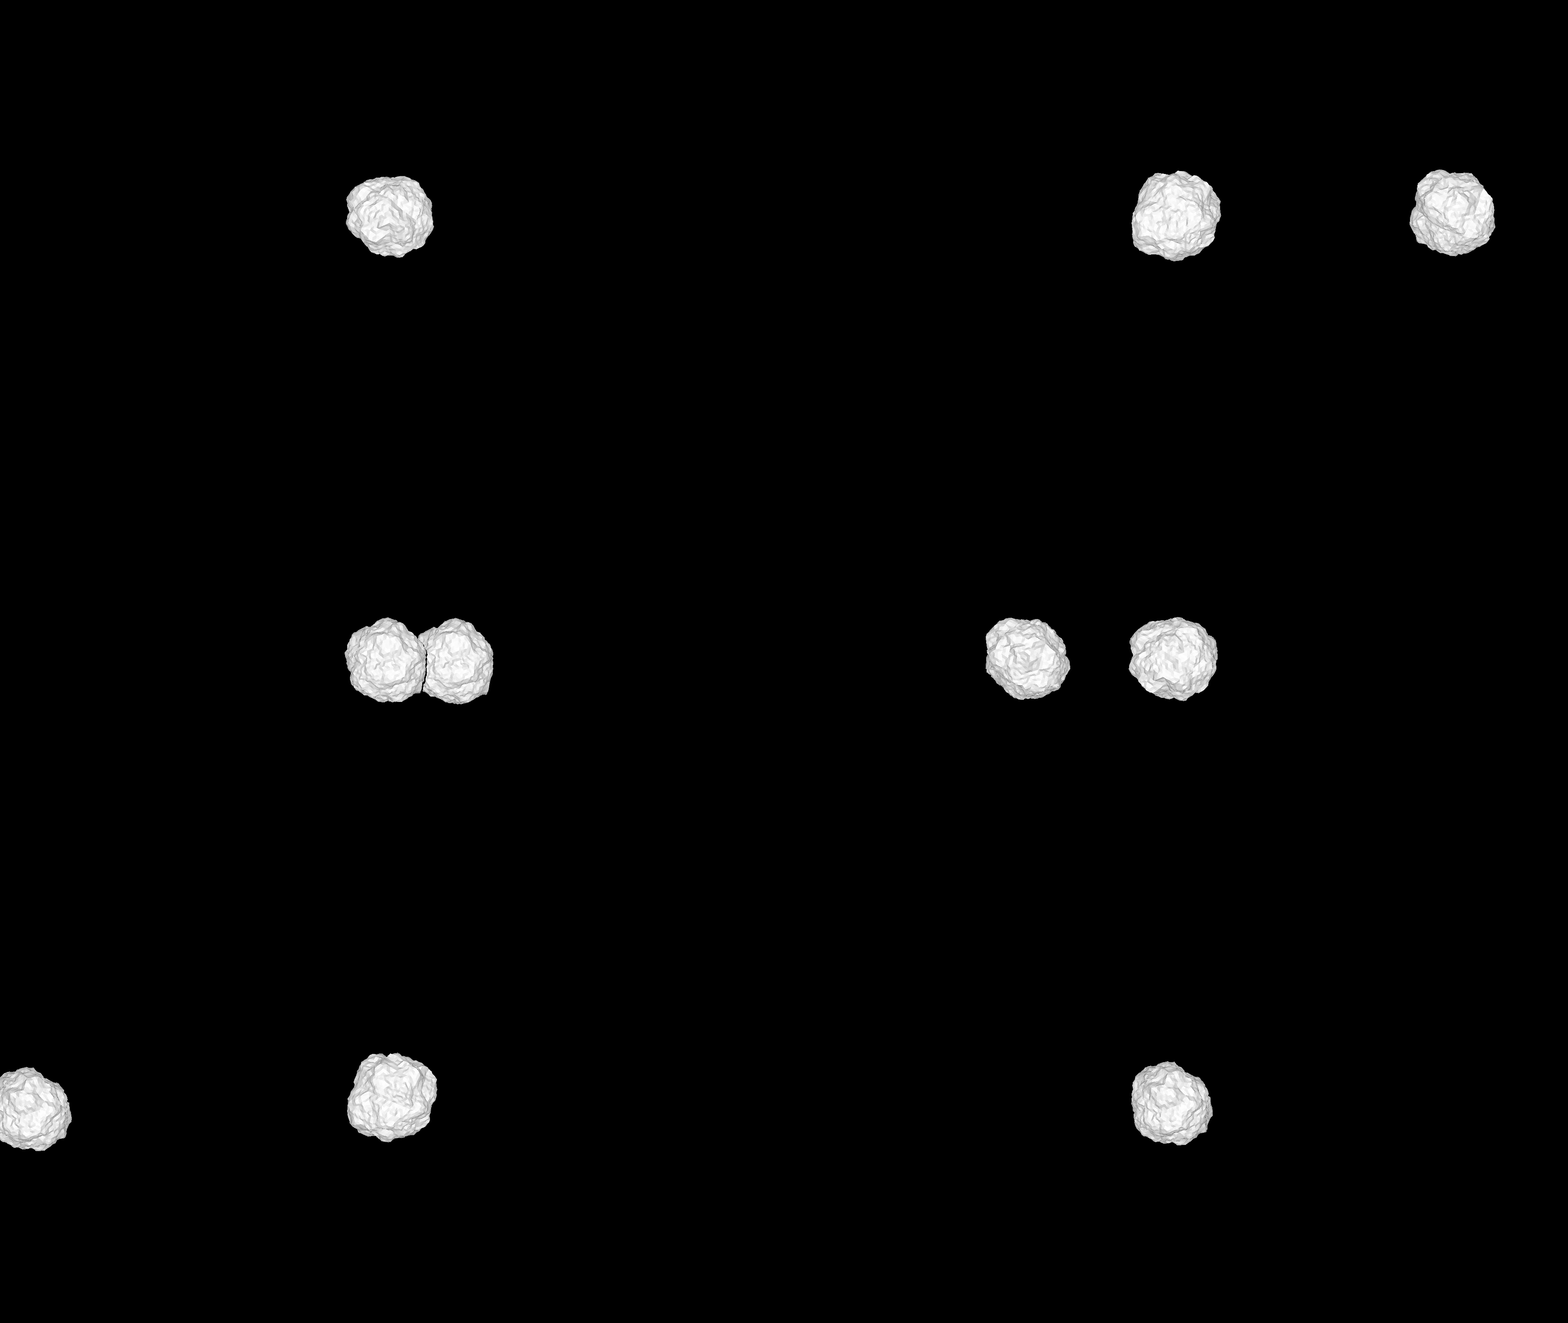
The above scene is of two objects, Sila and Nunam, in the Kuiper belt. The scene shows two faceted shapes. Faceted shapes are uploaded as a .obj file to the function and can be created by the user. This allows astronomers to render objects whose shape is known. The software also allows for Tri-axis Ellipsoids and Spheres to be generated and used. The generated shapes are faster and designed for use inside of a minimization routine.

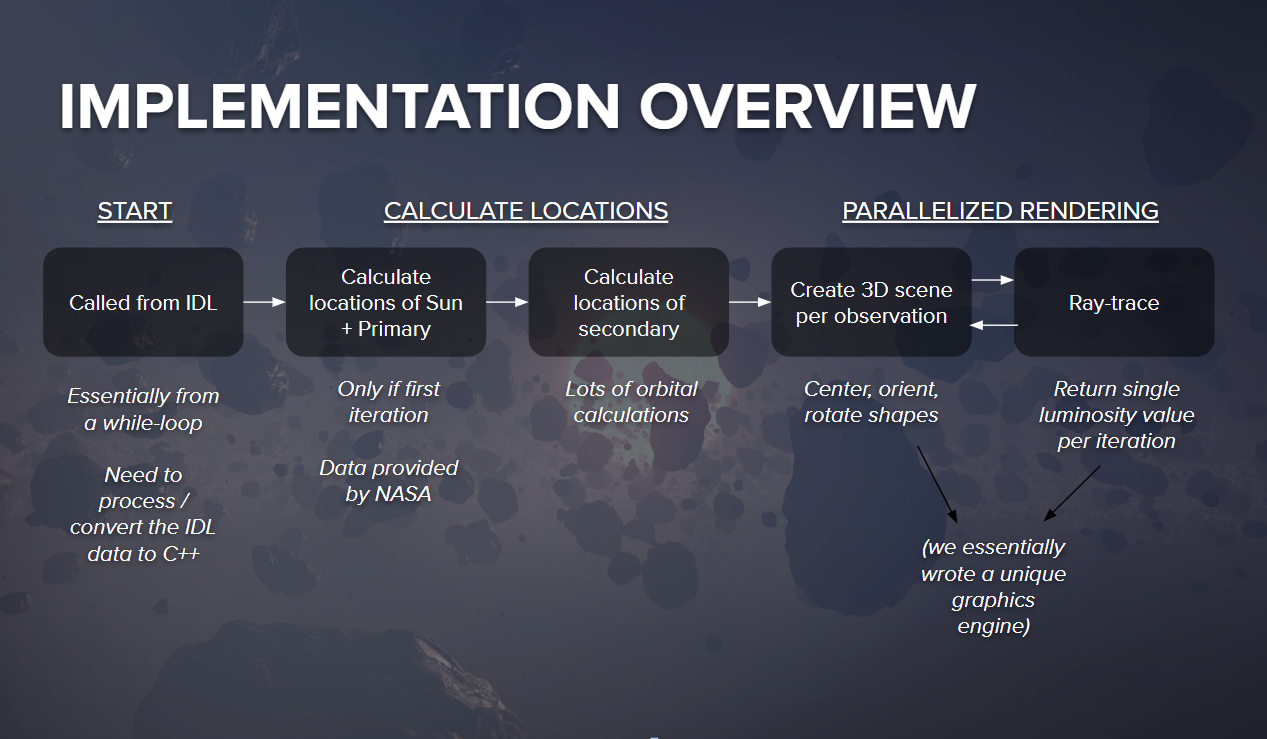
A single workflow was used to generate the Sila-Nunam scene. The flowchart below highlights the important steps.

Technologies

Our solution makes use of a variety of technologies. We notably did not use a graphics framework because we could not find one that met our needs. The technologies we did use were mostly for convenience and to avoid repeating work. Below is a list of technologies that we used:

  • C++ as our main language with wrappers in C and IDL - We decided on C++ as our main language because we wanted an objected oriented language that was fast. We wanted it to be object oriented so that we could create graphical objects for rendering. The speed of the language was also key because performance was a huge concern. Since C++ is statically typed and compiled, it beats out other languages like Python when it comes to speed.

  • Git for version control - GitHub was a huge part of our development cycle. Major programming tasks happened on separate branches which allowed us to develop concurrently. If one of us ran into an issue, it was easy for the other to check out the current branch and help out. Tracking the changes in GitHub also allowed for easy debugging.

  • Microsoft Visual Studio Code for consistent development space - VSCode is a lightweight IDE that also provides code completion, consistent formatting, and many other beneficial features for our project.

  • CMake as a build system for cross-platform development - CMake allows us to manage dependencies and add new files with minimal effort. It lets us avoid writing makefiles by hand, which would take far too long and require too much maintenance.

  • Travis CI for continuous integration - It allowed us to automatically run the unit tests we wrote on a virtual machine. It also tested different compiler and OS versions to ensure our code was running properly not just in our own development environments. Travis-CI shows when commits pass or fail the tests, allowing us to be confident that our changes are stable and ready for the next release.

  • GoogleTest as a testing framework - We used this because it allowed us to easily write tests that both ran in GitHub and on our own machines.

  • Eigen math library for vector math - Eigen math allowed us to easily have vector math in our code that was optimized. Most of the runtime for our project is in the ray tracing. All of the math in the ray tracer is vector math. By cutting down the time it takes to cross vectors even by a few instructions, we can speed up our code noticeably.

  • TinyJPEG as our JPEG encoder for rendering - We decided to use JPEG as a file output format because its compressed. Originally we were using .pgm files, but they became too large to store in memory. JPEGs are a good format for us, and the JPEG encoder header just let us avoid having to write our own.


Project Schedule

Below is a chart showing the weekly timeline of the tasks necessary to complete our solution for this capstone:


Code Base

The code base is currently private but will be public in the future.