The team used the City of Flagstaff Stormwater Design Manual (2009) to find the design requirements for the drainage design. Chapter 4 of the Design Manual was used for the open channel requirements, Chapter 5 was used for the design requirements for the culvert design, and Chapter 8 was used for the design requirements for a detention basin.
Existing Topography
ArcGIS and USGS was used for the topography of the project site.
 Image: USGS
Existing Plans
The drawings for the Flagstaff Master Draiange Plan was used to document the exisiting structures.

Image: Flagstaff Master Draiange Plan
FEMA Floodplain
Using flood maps, the flood hazard area was determined to have a 0.2% chance of experiencing a 500-year flood event. The flood map is shown in the figure below.

On February 4th 2023 the team conducted a site visit where a Global Navigation Satellite System (GNSS) was used to survey the elevation of the area.
Documentation of Existing Structures
I n the site visit, the exisiting structure's characteristics were measured and recorded. The channel was divided into different sections since it has different widths and height along the entire channel. A schematic of the different sections in the channel can be seen in the figure below.

Image: Google Maps
Land Surveying
A survey of the area next to the 90-degree bends was conducted to collect topographic data that was not available to the team.
Topographic Map
The topographic data collected was drawin using AutoCAD Civil 3D, the topographic map of the entire project along with the channel profile and alignment can be seen on the figure below.

Image: AutoCAD Civil 3D
The watershed delineation was obtained from using Google Earth Pro, it is outlined in red in the figure shown below. Three main flow paths were determined (in blue). 
Image: Google Earth Pro
Time of Concentration
Using the time of concentration estimation equation the team determined that the time of concentration for the longest flow path was 41 minutes for the 25-year storm.
Rainfall Intensity
The corresponding rainfall intesnity for the 25-year storm was 2.52 inches per hour.
Runoff
Using the Rational Tool Method the discharge for the watershed was determined to be 439.1 cfs for the 25-year storm and 701.3 cfs for the 100-year storm.
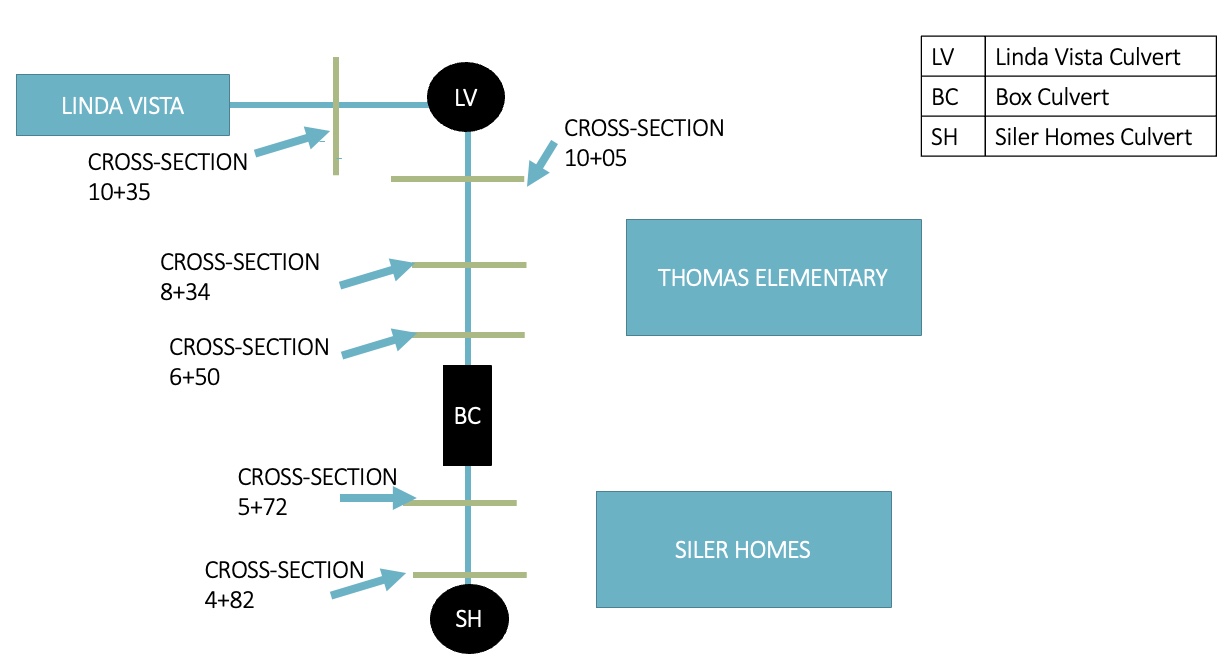
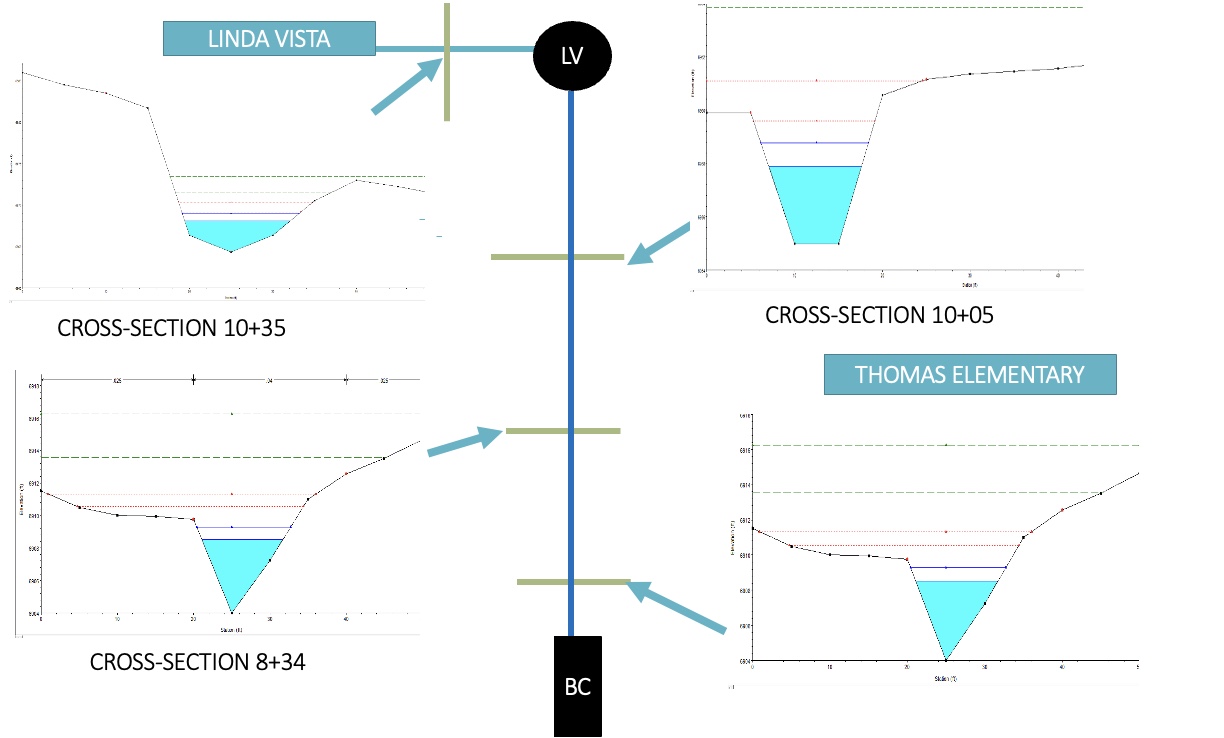
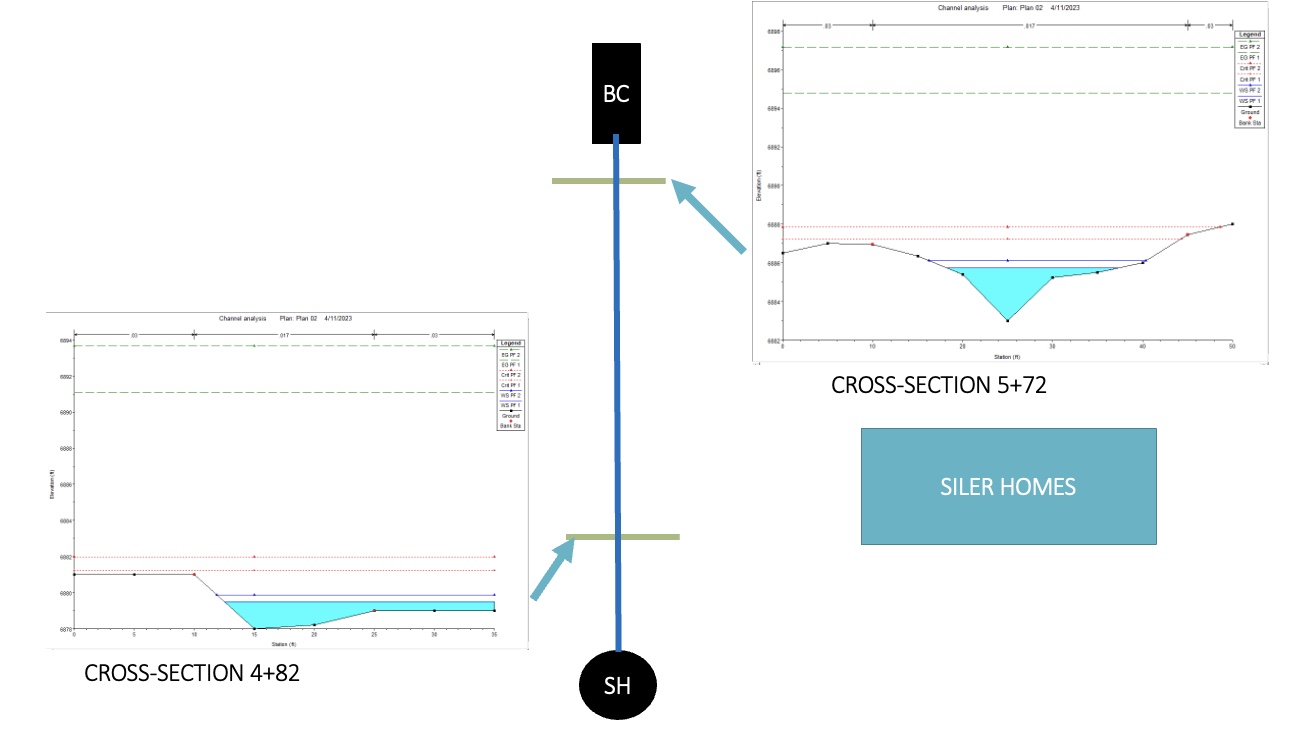
The open channel analysis was conducted by analyzing different cross-sections of the channel.

Image: Cross-Sections of Channel
Credit: Sneha Joshi

Image: Cross-Sections 10+35, 10+05, and 8+34
Credit: Sneha Joshi

Image: Cross-Sections 5+72 and 4+82
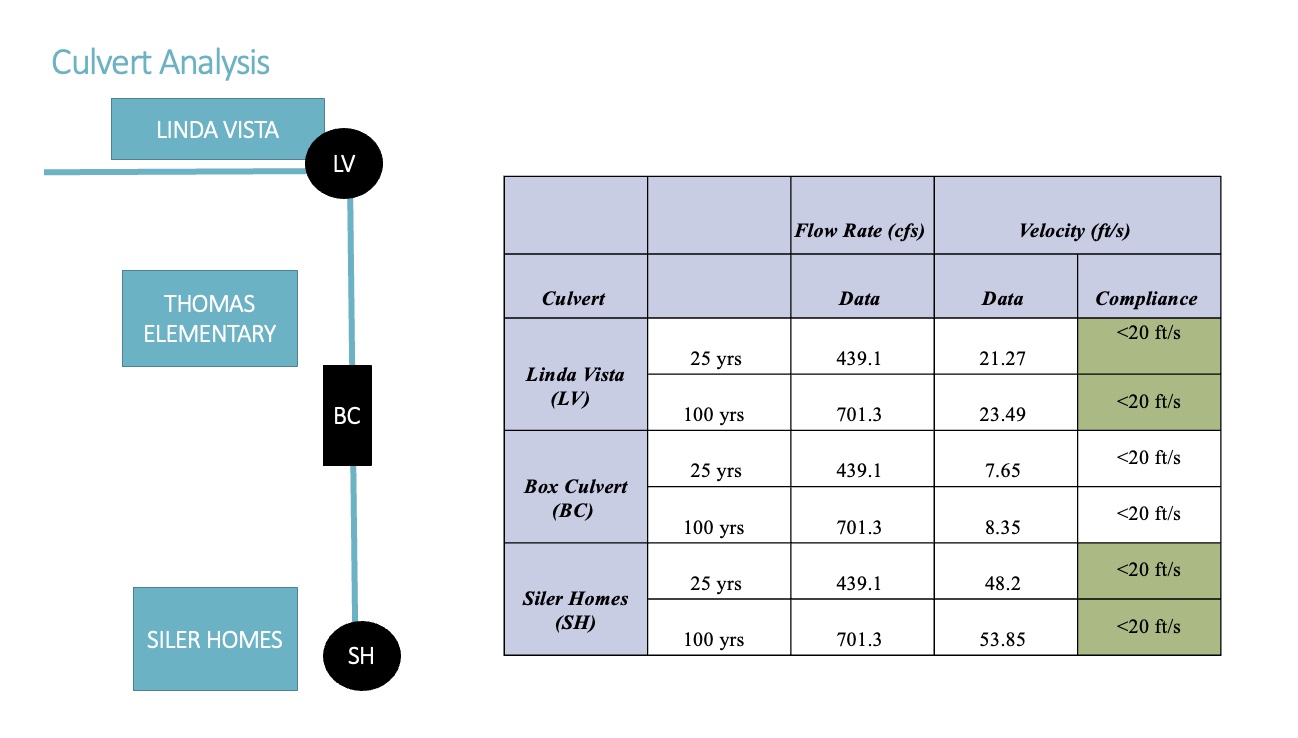
Culvert Analysis
A culvert analysis was performed to determine if the culverts were meeting the city requirements. The analysis can be seen down below where the culverts at Linda Vista and Siler Homes are not in compliance.

created with
HTML Designer .