Proposed Solution Home Project Information Documents Photo Gallery

Research and Alternatives

A lot of research and decision making went into the solution and the team explored all alternatives that were possible given the constraints of the project. Initial research considered all avenues of treatment technology, including aqueous-phase VOC treatment of the produced water (PW), but early on the team decided to pursue a method of gaseous-phase VOC treatment by way of stripping the toluene out of the PW and then treating it in air. This was mainly because of three reasons; the innovation factor involved with the scoring at the competition, the characteristics of the PW, and because of project constraints with budgeting and time.

Once the team had decided upon a method of gaseous-phase VOC treatment of the PW, there then needed to be two decisions matrices created. These matrices were made to sort through the variety of technologies associated with each stage of treatment. Stage one involved stripping the VOCs from the PW and the second stage focused on cleaning the VOCs out of the air after the stripping process through a method of adsorption. A method of adsorption as the teams second stage cleaning process was chosen due to project constraints with lab access and safety, budget, and time.

The decision matrices used were created by the team and included the following categories and scoring weights based off of competition scoring criteria as well as project constraints.

The two decisions matrices that the team created can be found as links below. These matrices did require design work to help with the decision process and the design work completed with be discussed in the next section of this page.

Adsorption Decision Matrix Stripping Decision Matrix

Design Work

Stripping Process Calculations

In order to complete the stripping decision matrix, mass transfer calculations had to be done for every stripping technology considered. In total, 5 technologies were considered for this stage of the treatment process and by default 3 of those were decided against due to the properties of toluene, the VOC being treated, being incompatible with those technologies. The mass transfer calculations for the packed tower and bubble column can be found below. The highlighted kLa values in each table represent the capacity coefficient for each technology given the operating conditions. A higher kLa value was what the team was looking for and what ultimately led to the teams decision to use bubble column technology.

Mass Transfer Calculations

Adsorption Testing

Out of all the different adsorption materials in our decision matrix, the team decided to pursue a type of biochar. Biochars currently do not have a lot of formal research on their adsorptive properties and this can be attributed to the fact that biochars can be created and sourced from a variety of processes and materials. Because of this, the team needed to perform lab testing to determine the adsorption capacities of the biochars being considered for implementation into the bench scale model. 

Two biochars were tested using a constant gas volume method. The biochar that was used in the bench scale model, biochar A, was sourced from dead trees that had been infested with bark beetles, and biochar B was sourced from wastewater sludge. Both of these biochars are commercial products and were chosen because of their sustainable production process and sourcing. Throughout the entirety of testing, the team ran into several issues with lab equipment inconsistencies so the results may not be entirely accurate, however, the adsorption capacities as well as images of each biochar can be found below.
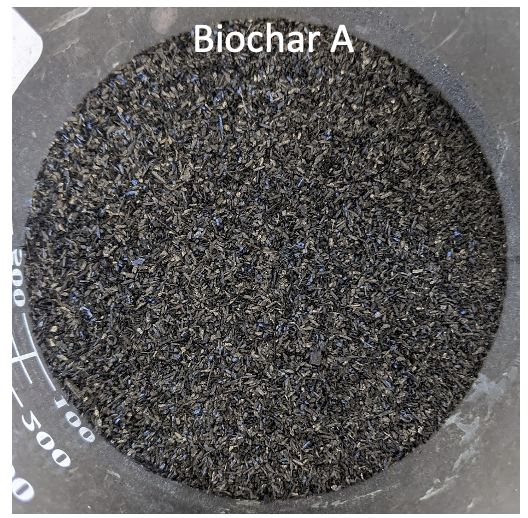
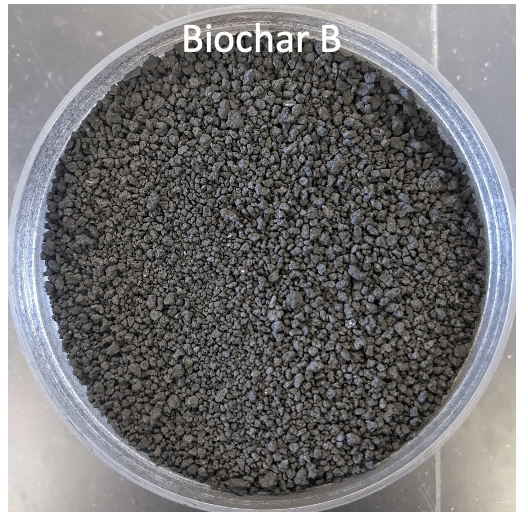
Biochar A

Experimental adsorption capacity: 0.912 mg Toluene/g biochar

Biochar B

Experimental adsorption capacity: 0.175 mg Toluene/g biochar

Column Construction and Testing

Once the team chose the technology to be used in each stage of treatment by way of the decision matrixes discussed above, construction of the model began. Construction of the model followed the process flow diagram that can be seen in the link here: Process Flow Diagram. The team was able to use mostly repurposed materials sourced within the lab at NAU to create a fully functional and closed system bench scale model that was capable of removing VOCs from a synthetic PW solution. Photos of the construction process can be found on the photo gallery page. Additionally, after complete construction, the team created mass balance diagrams to display toluene concentrations throughout the two stages of treatment. Those diagrams can be found in the link here: Bench scale model mass balance diagrams.

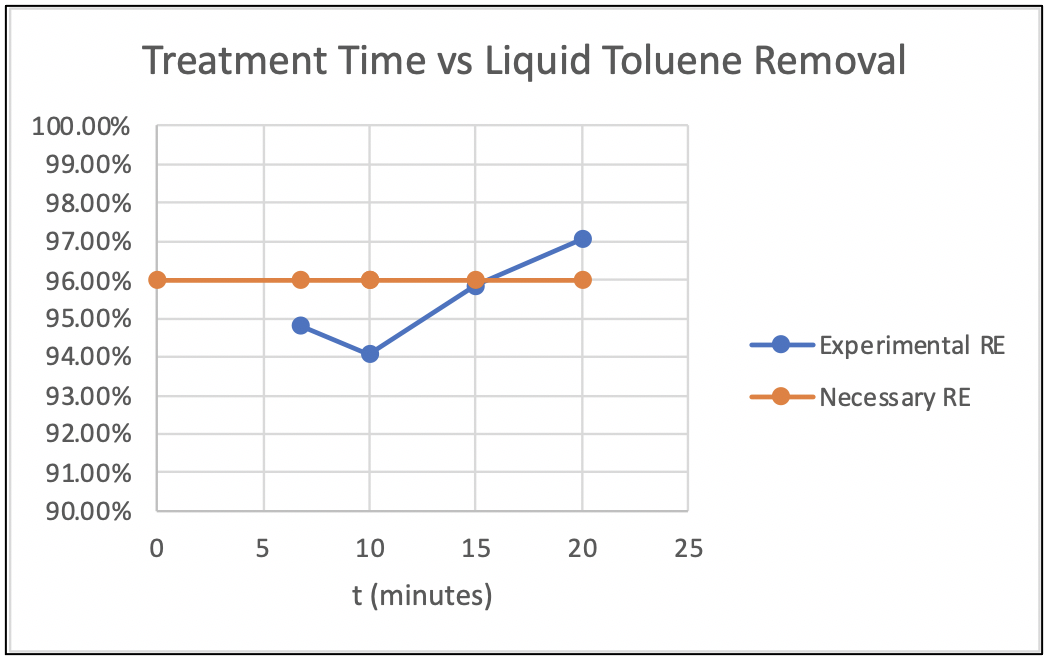
After completion of the models construction, the team did performance testing of the column. This was done to test the time needed to reach 96% removal efficiency and to see how much biochar was needed to fully filter the toluene out of the air before releasing the effluent air into the atmosphere. To find the time needed to remove 96% of the toluene present in the PW, the team would take liquid samples out of the column during treatment at certain time increments and test the concentration with a Gas Chromatograph (GC). As shown in the figure below, the time needed for treatment using the teams technology was about 16 minutes. 

To test the effectiveness of the adsorption filter, the team took samples of the air being released from the stripping process both before and after being passed through the teams adsorption filter that was packed with biochar A. Samples were taken with Tedlar bags and passed through a GC. The link here: Column VOC air emission test data, will display the testing data as well as efficiencies acheived. Based off of this data, the total biochar needed to fully clean the toluene out of the air before being emitted from the teams bench scale model was 9.2 grams.

Proposed Solution

The solution that the team designed and built was a closed system bubble column reactor with a biochar adsorption unit attatched. This design is pictured on the left and was built as a fully functional model capable of treating about 1 liter of PW from a concentration of 50 ppm to 2 ppm within 16 minutes.

In addition to a working bench scale model, the team had to use key design aspects from the model to create a full scale design. This design had to be capable of treating 50,000 bbl/day, have competetive construction costs, and an operating cost less than $0.25/bbl. 

NAU's full scale design consisted of 5 stripping column batch reactors that would release VOCs up into the air to be caught in biochar based adsorption units that topped each column individually. Like the bench scale, each column would only need 16 minutes to treat the water down to 2 ppm. This design would be capable of treating 50,000 bbl/day, and more importantly, keep VOC emissions down to 2 tons per year, based on the potential to emit. This design was estimated to cost $783,848.90 with an operating cost of $0.16/bbl. The links below will showcase the full scale design AutoCAD drawing, dimensions and operating condition, and lifecycle cost analysis.

AutoCAD Mockup Dimensions Cost Analysis

Awards Received

Best Bench Scale Model

The team had performed well during the bench scale model demonstration and constructed a model that had impressed the judges. NAU won the award for best bench scale model within their task.

Outstanding Student Award

In addition to the teams performance, team member Hannah Robino won an individual award. The Outstanding Student Award in Memory of Intel's Terry McManus was awarded to only three out of over 100 students, and Hannah Robino was one of them for her resourcefulness and performance during the project.