Northern Arizona University
2021 Steel Bridge Capstone Team
RISA Modeling
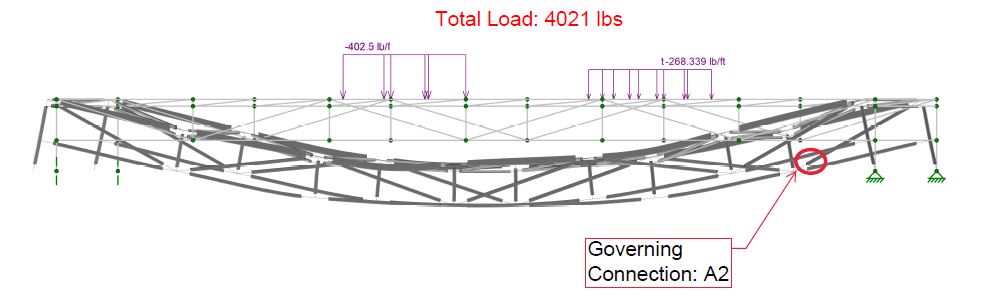
The bridge analysis was completed in RISA in order to determine the internal axial forces in each member. Below is an example of the model in RISA with an applied load and its associated deflection. This model represents the load case used in the final feild testing - Load Case #2. In this scenario, connection A2 governs the bridge's maximum capacity.
Capacity vs. Demand
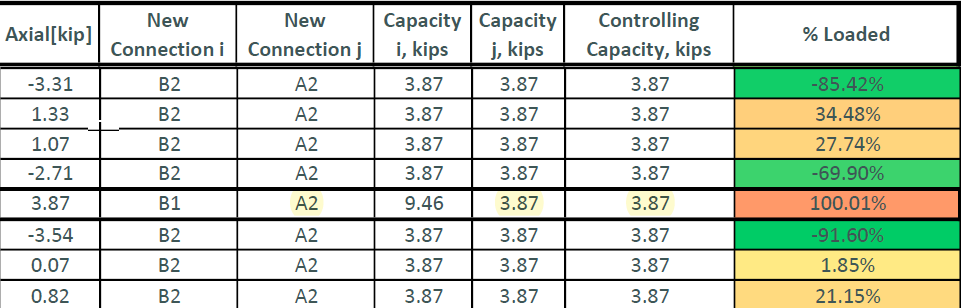
The axial forces gathered from RISA were compared to the calculated capacities of each connection attached to each member. Below is an example of the table used to compare these value and check when a connection is reaching its capacity (100% loaded). This is how the governing connection for each scenario was determined. Here it is calculated that connection A2 governs, which is consistent with the above figure.
Overall Performance Comparison
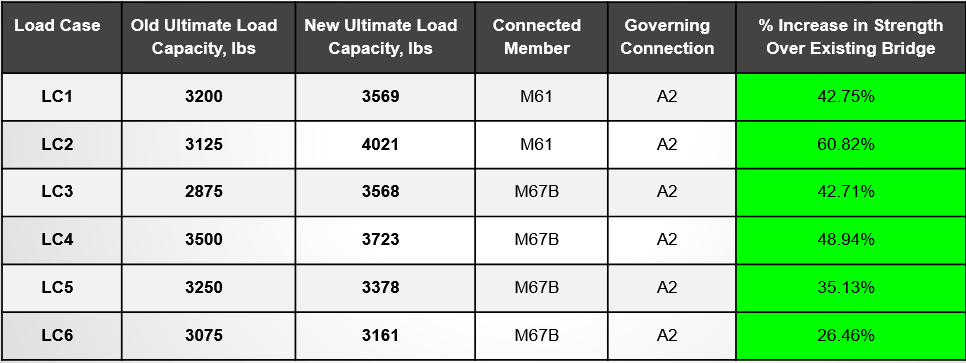
This table shows a comparison of the bridge's performance under load with the old and new connection designs. In all cases, the new designs improved the overall bridge capacity.
- Last Updated 4.27.2021