Progression
Seen here is the list of tasks developed by BETR Engineering for the expected path of project completion. Each main task is an individual portion of the project and may include subtasks depending on the intermediate steps that will need to be taken toward task completion. Each of these tasks, and their respective subtasks, make up the project workflow. To see a timeline arrangement, view the Gantt Chart included below the task list.
Task List
- TASK 1: Review Existing Data
- 1.1 Traffic Data
- 1.2 Survey Data
- 1.3 Right-of-Ways
- TASK 2: Site Investigation
- 2.1 Surveying
- 2.2 Field Notes
- TASK 3: Existing Site Conditions
- 3.1 Existing Topographic Map, Structures, and Environmental Features
- 3.2 Existing Roadway Alignments
- TASK 4: Roundabout Design and Check
- 4.1 Preliminary Roundabout Design
- 4.1.1 Radius of Inscribed Circle
- 4.1.2 Assessment of Lanes
- 4.2 Grading to Roundabout Requirements
- 4.3 Hydrology Assessment
- 4.3.1 Contributing Area and Weighted Runoffs Coefficient
- 4.3.2 Duration and Intensity
- 4.3.3 Design and Check Storm Volumes
- 4.4 Hydraulic Assessment
- 4.4.1 Assess Flow Criteria
- 4.4.2 Hydraulic Structures
- 4.5 Finalize Roundabout Geometry
- 4.5.1 Roadway Alignments
- 4.5.2 Splitter Islands and Crosswalks
- 4.5.3 Safety and Code Checks
- 4.5.4 Redesign as Needed
- TASK 5: Signage and Striping
- TASK 6: Temporary Traffic Control
- TASK 7: Plan Set Production
- TASK 8: Drainage Analysis
- TASK 9: Traffic Analysis
- TASK 10: Evaluate Project Impacts
- 10.1 Social Impacts
- 10.2 Economic Impacts
- 10.3 Environmental Impacts
- TASK 11: Project Deliverables
- 11.1 30% Submittal
- 11.1.1 30% Report
- 11.1.2 30% Presentation
- 11.2 60% Submittal
- 11.3.1 60% Report
- 11.3.2 60% Presentation
- 11.3 90% Submittal
- 11.3.1 90% Report
- 11.3.2 90% Website
- 11.4 Final Submittal
- 11.4.1 Final Report
- 11.4.2 Final Presentation
- 11.4.3 Final Website
- TASK 12: Project Management
- 12.1 Meetings
- 12.2 Schedule Management
- 12.3 Budject Management
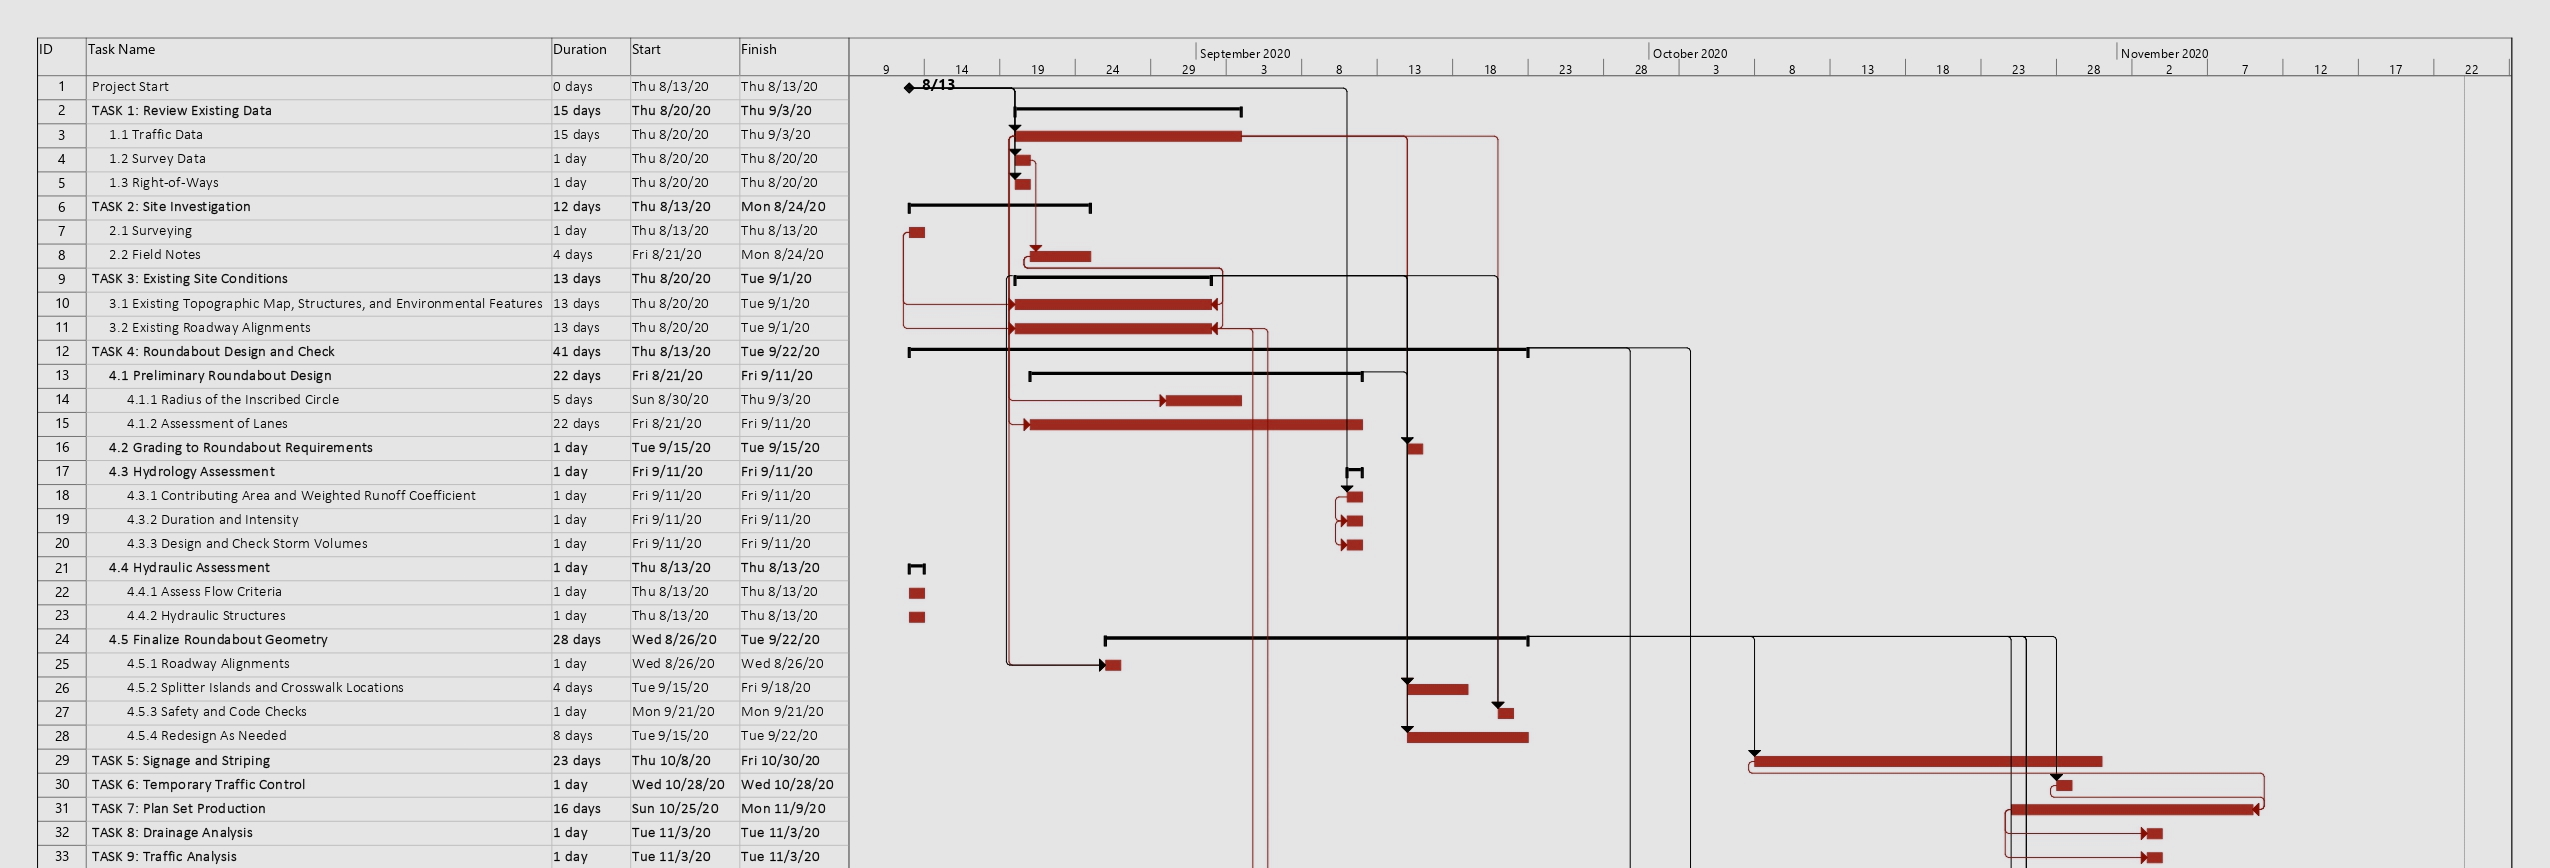
Gantt Chart
Available for viewing here is a Gantt Chart showing the timeline of task completion for the project. This gantt chart shows each task with its associated duration of work in both a list and chart format. To see the full Gantt Chart, click the image to the right and the chart will open in a new window.
