Data Correlation and Exposure Point Concentrations
Data Correlation
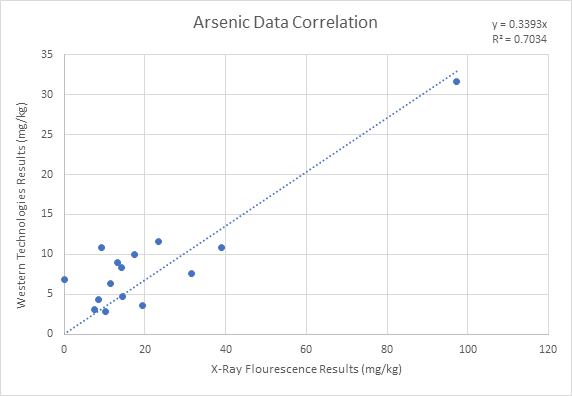
The data from the XRF results and Western Technologies readings was plotted using Excel. The scatter plot formed from this analysis is shown in figure below. The x-axis on the scatter plot shows the XRF readings while the y-axis shows the Western Technologies results. To correlate the data a trend line that was forced through zero was applied to the plot and the linear equation and r-squared value was added. This chart produced a r-value of 0.8387 which confirmed the lead interference with the arsenic readings from the XRF device. This correlation (y=0.3393x) was used to correct XRF arsenic data for further risk assessment.
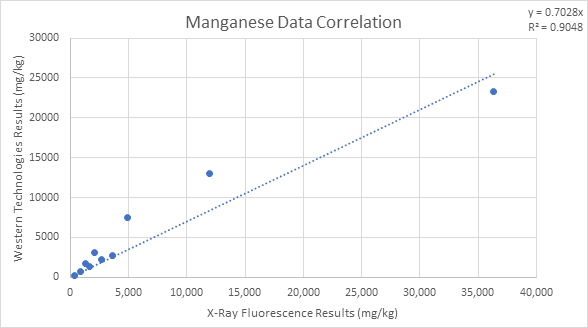
The scatter plot formed from the analysis for manganese is shown below in the figure. The r-value generated from the correlation was 0.9512. This correlation and trendline equation (y=0.7028x) was used to correct the XRF manganese data for further risk assessment.
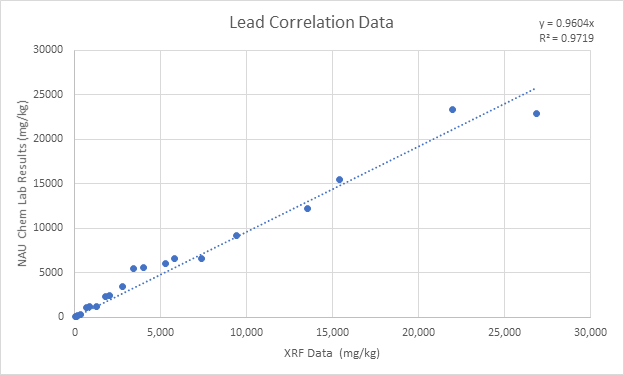
The scatter plot generated for lead is shown in the figure below. The correlation showed a r-value of 0.9859. This correlation (y=0.9604x) was used to correct XRF lead data for further risk assessment.
Exposure Point Concentrations
The adjusted XRF data was utilized to create distributions for each element. This information is presented in the following figures.
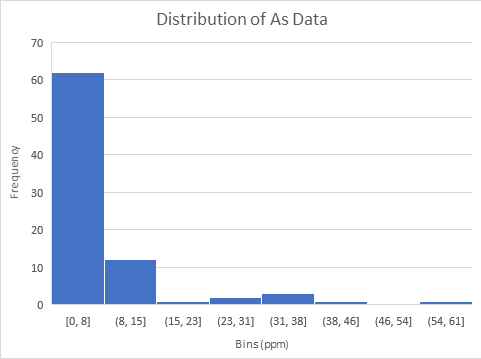
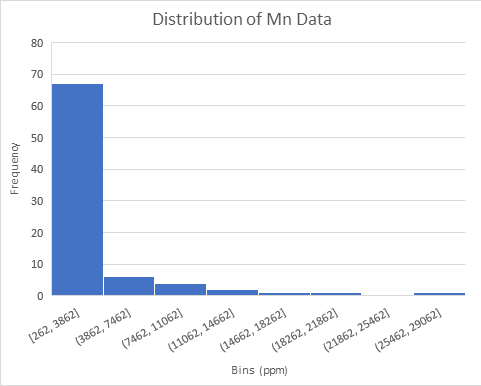
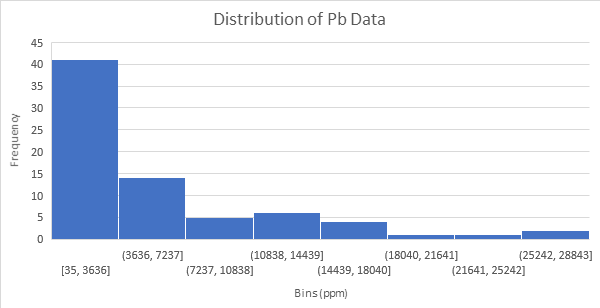
Due to the irregular distributions of the data, the data was transformed by taking the natural log of the adjusted value. The natural log values were utilized to create a natural log distribution for manganese, arsenic, and lead. These distributions are shown in the following.
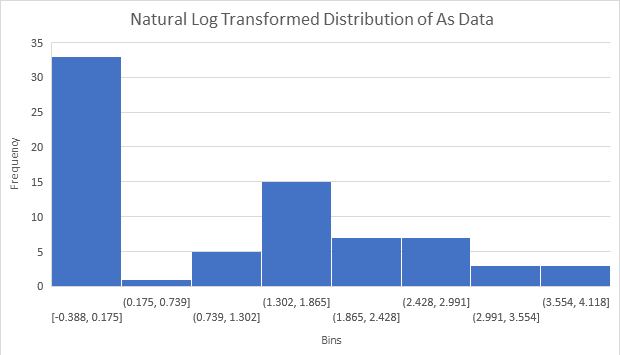
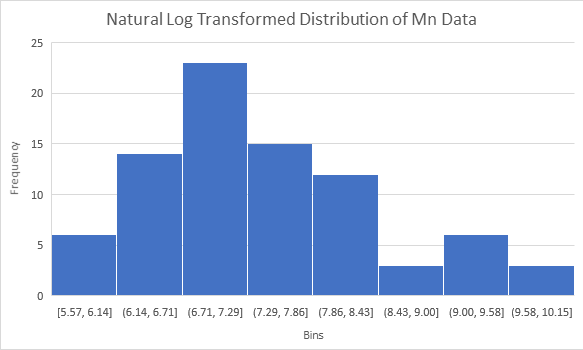
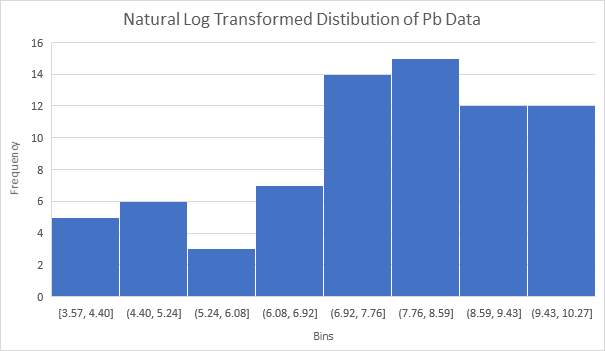
The natural log transformed for each contaminant reflected a more normal distribution. These distributions were utilized to determine the exposure point concentrations for the contaminants. The 50% exposure point concentration was determined geometric mean. To determine the 95% exposure point concentrations, the modified Cox method was utilized on the natural log transformed data set, and then unlogged to get the 95% exposure point concentration.
The 95% EPC, 50% EPC, standard deviation, and average for the contaminants of concern are summarized below.
| Contaminant | 50% EPC (mg/kg) | 95% EPC (mg/kg) |
| Manganese | 1662.5 | 3298.7 |
| Arsenic | 3.2 | 10.1 |
| Lead | 2023.4 | 16425.6 |