Flood Data
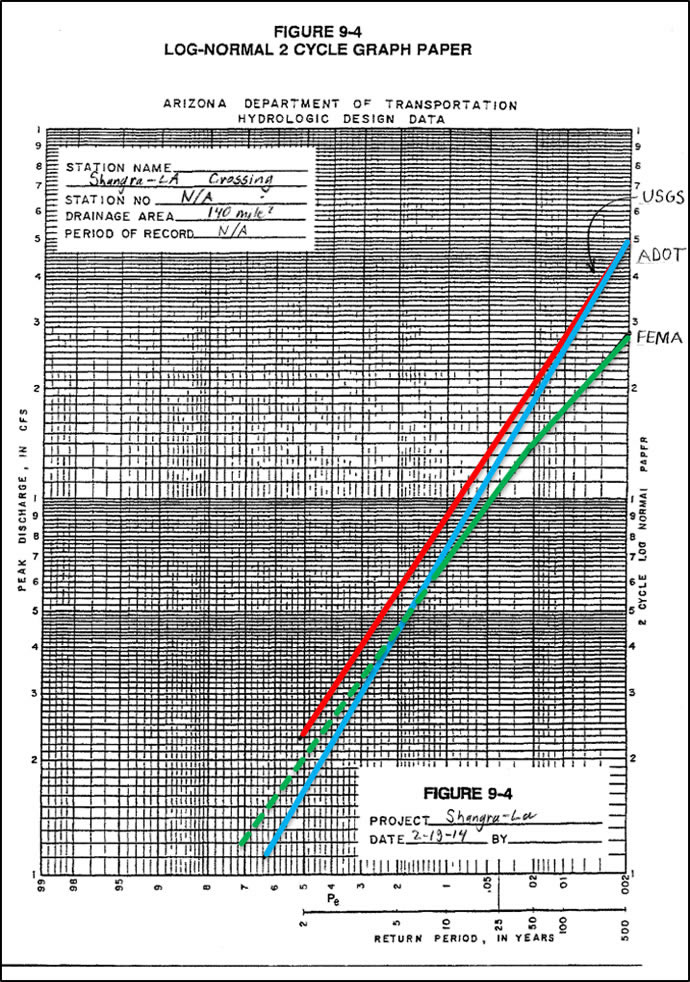
Three main entities were used to determine an accurate flood model: USGS, FEMA, and ADOT. FEMA had the most accurate flood data because a study was performed 1.5 miles south of the project site. This is close enough to the project site to be correct. In the picture below FEMA is outlined in green, ADOT in blue, and USGS in red. The dashed green line is extrapolated data.

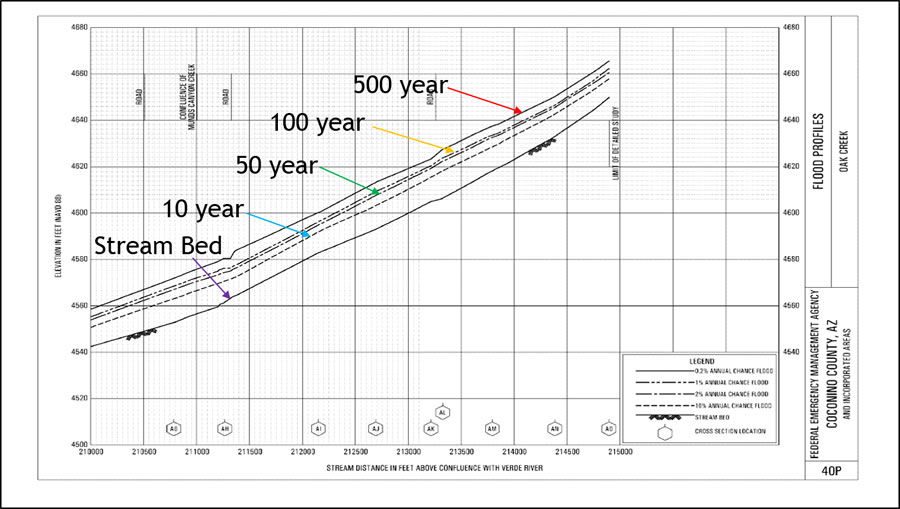
The FEMA Flood Profile below was taken approximately 1.5 miles downstream from the project site area. This allowed the team to see what the elevation change for each year storm is approximately in relation to the stream bed. This data was cross-referenced with the HEC-RAS data to ensure that the model was correct.

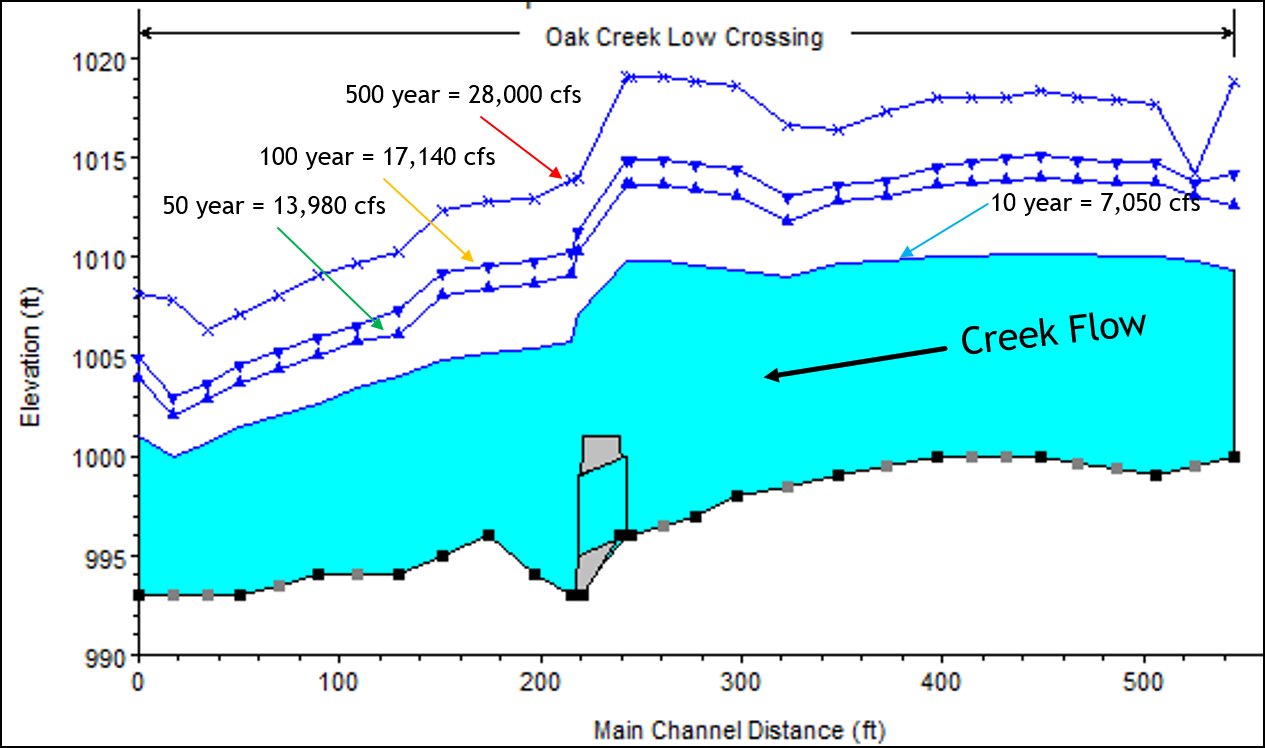
The HEC-RAS model shown below is a model of the current crossing and how the 10-, 50-, 100-, and 500-year floods compare. It is evident in the model that the 10-year storm is approximately eight feet above the crossing.

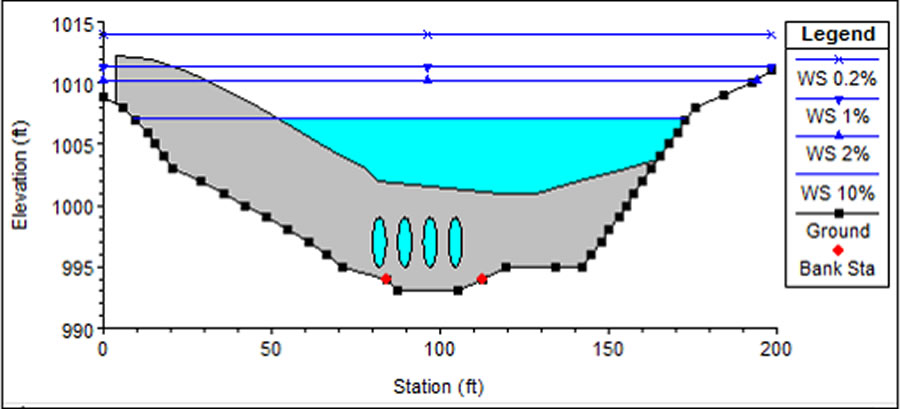
The HEC-RAS model below shows another view of the current crossing and the elevations of the 10-, 50-, 100-, and 500-year floods in comparison to the elevation of the crossing. As said before, the 10-year storm is apprxoimately eight feet above the crossing.
