Abstract:
Joy Cone Company is looking to further automate an ice cream cone manufacturing line in their Flagstaff, AZ plant. To achieve this automation, team Autocone developed systems to detect and reject cones containing major flaws, stack a specific quantity of cones, provide a temporary storage area for cones due to unexpected system malfunctions, and transport cone stacks to a current packaging line. Team Autocone performed detailed state of the art research to develop a foundation of knowledge of the current manufacturing line. With this knowledge, design concepts were developed for the systems outlined. These developed design concepts are believed to have a successful impact in further automating the manufacturing line. In this presentation, team Autocone will explain their design process and present their final design.
Project
Description:
Joy Cone Company is looking to further automate an ice cream
cone manufacturing line in their Flagstaff, AZ plant.
To achieve this automation, team Autocone developed systems to detect and
reject cones containing major flaws, stack a specific quantity of cones, provide
a temporary storage area for cones due to unexpected system malfunctions, and
transport cone stacks to a current packaging line.
Team Autocone performed detailed state of the art research to develop a
foundation of knowledge of the current manufacturing line.
With this knowledge, design concepts were developed for the systems
outlined. These developed design
concepts are believed to have a successful impact in further automating the
manufacturing line. In this
presentation, team Autocone will explain their design process and present their
final design.
Requirements/Specifications:
There have been several problem areas demonstrated within the
current setup of Joy Cone’s manufacturing line.
The following list of requirements and specifications have been developed
based upon Joy Cone’s requests and concerns, along with the team’s observations
from touring the plant and viewing the current system’s function.
1.
Reduces human effort between
the manufacturing and packaging lines
2.
Improves handling between
the manufacturing and packaging line
3.
Reduces the labor force
required from 2 packers to 1 packer
4.
Fixed in location as long as
it does not interfere with current or future planned operations which the line
must perform
5.
Adhere to the United States
FDA (Food and Drug Administration) rules and regulations for food manufacturing
6.
Compliant with OSHA
(Occupational Safety and Health Administration) proximity guidelines for
robotics
7.
Settings on the oven and
packing systems cannot be changed
8.
Inspects cones for defects
and rejects nonconforming cones into the existing scrap system
9.
Has the ability to stack the
cones in groups of 6
10.
Can deal with equipment
malfunctions and downtimes of up to 2 hours
a.
Able to store baked cones in
a staging area in the event that a piece of packaging equipment becomes
inoperable
b.
Can introduce the stored
cones from the staging area back into the packaging line after the inoperable
equipment has been fixed
11.
Capability of adapting to
different manufacturing situations
12.
Solution concept must be
animated in a virtual environment for illustration purposes
The team took measurements of several
structures such as the production line, packing line, and any fixed structures
that would set limits on our working area for the new design layout.
We also took measurements of the cones individually and of the cones once
they were stacked in groups of six.
Figures 1 and 2 in the Appendix show drawings along with applicable dimensions
of the cones. In Figure 3 of the Appendix is the layout of the production
equipment and the pillars around our working area.
Weights of cones and stacked cones were also taken for use when designing
a storage system. The weight of a
single cone is 7.75 grams, and the weight of
Significant milestones.
Helps the user to simulate a
manufacturing environment for decision making purposes
Can be used to improve
performance for various different manufacturing applications
Statistical analyses of the
model can be produced from the ProModel simulations
Our team used ProModel as a
simulation environment for the purposes of visualizing our final design and
verifying our statistical analyses
Currently one of the most
popular products in the 3D mechanical CAD market
Utilizes a parametric
feature-based approach to creating models and assemblies
Our team used SolidWorks to
model our components and subsystems, develop an overall layout for the entire
manufacturing line, and to animate the final design for verification and
visualization purposes
Development process
In the proposal
document, the team had decided to develop a robotic arm that would take the
product from the manufacturing line to the packaging line.
After refining the requirements with the customer there was need for
additional systems to be incorporated into this design.
Referring to the decision matrix below in Table 1, you can see that
the conveyor system scored the highest, meaning it is the most sensible
solution for the requirements and needs of the customer.
Table 1.
Statistical Analysis Results
|
|
|
ALTERNATIVES |
|||
|
|
|
Robotic Arm |
Conveyor System |
||
|
CRITERIA |
Weight |
Rating |
Score* |
Rating |
Score* |
|
Inspection |
5 |
1 |
5 |
4 |
20 |
|
Rejection |
5 |
1 |
5 |
3 |
15 |
|
Stacking |
5 |
1 |
5 |
5 |
25 |
|
Sorting |
5 |
1 |
5 |
5 |
25 |
|
Humanless |
4 |
5 |
20 |
4 |
16 |
|
Degree of
Automation |
4 |
4 |
16 |
5 |
20 |
|
Ease of
Implementation |
3 |
5 |
15 |
5 |
15 |
|
Sanitation |
5 |
4 |
20 |
5 |
25 |
|
Reliability |
4 |
5 |
20 |
4 |
16 |
|
System
Cost |
3 |
5 |
15 |
2 |
6 |
|
System
Lifetime |
3 |
5 |
15 |
4 |
12 |
|
TOTAL
|
38 |
141 |
46 |
195 |
|
|
1 = Low |
|
* Score =
Rating * Weight |
|||
|
3 =
Somewhat |
|
|
|
|
|
|
5 =
Extremely |
|
|
|
|
|
A robotic arm
could not accomplish all aspects that the customer was looking for in the
design solution. For instance,
a robotic arm would not have the capacities to solve the inspection,
rejection, stacking and sorting issues which the customer found to be of
utmost importance. Using the
decision matrix to evaluate the robotic arm and the conveyor system ideas
against criteria of importance to the client, it was realized that the
conveyor system would be the best solution for our application needs.
With the help of the decision matrix, the team decided to scrap the
idea of a robotic arm and has decided to go with a conveyor system which
will include various subsystems.
These subsystems are to include:
Statistical Analyses
The time between
the release of each batch of cones from the oven once each batch touched the
conveyor was recorded thirty times for the analysis.
Due to the increased human error in approximating the time at
which the cones reached a fixed point, the time between batches in the above
manner was preferred. This
method yielded better results and produced less human error.

Figure 1.
Calculation of Standard Deviation
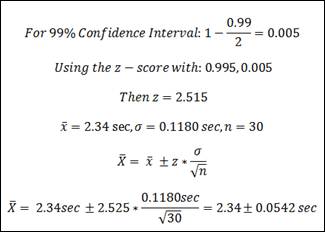
Since the sample size was greater or equal to 30, a z-score was used in obtaining the results. For the calculations, please refer to Figure 1 above for further clarification on how the results were obtained.
The calculations
resulted in a mean batch time of approximately 2.34 seconds with a standard
deviation of 0.1180 seconds and a variance of 0.0139 seconds2.
Using a confidence interval of 99%, the mean was expected to fall
between approximately 2.28 seconds and
2.39 seconds.
These results are summarized in Table 2.
Table 2.
Statistical Analysis Results
Possible errors
in the statistical analyses may involve: human error with attaining the
times (visualizing the cones), human response time when using the start and
stop on the stopwatch, accuracy of the stopwatch, consistency of the
machinery and also the trimmer.
However, all of these things have minimal impact on the results.
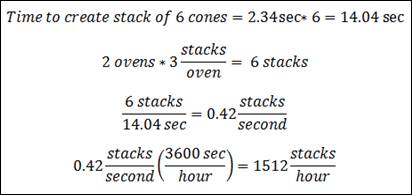
For calculation
purposes, the time it would take for a stack of six cones to accumulate was
needed in order to generate the flow rate for the production of the stacks
of cones. This resulted in a
flow rate of 1,512 stacks of cones produced per hour, assuming perfect
conditions and no rejected product.
The flow rate calculations can be further explored below in Figure 2.

Figure 2.
Flow Rate Calculations
Joy Cone
occasionally experiences downtimes of up to two hours, for which they would
like to have an overflow storage system for the stacks of cones.
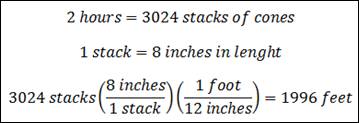
It was determined that an overflow system would need to store about
2000 feet of stacked cones for the given time period.
If spacing is to be involved between each cone stack, this value
could begin to exceed nearly 4000 feet.
For further details into the calculation of the storage capacity for
the overflow storage system, please refer to Figure 3 below.

Figure 3.
Overflow Storage System Capacity Calculations
Pro
Model Analyses
ProModel is a
robust simulation-based decision making tool that is mostly used in the
manufacturing industry. This
program helps the user to simulate a manufacturing environment for decision
making purposes. The program
can be used to improve performance for various different manufacturing
applications. Statistical
analyses of the model can be produced from the ProModel simulations.
Our team used ProModel as a simulation environment for the purposes
of visualizing and verifying our final design.

Figure 4.
Joy Cone Layout for ProModel Simulations
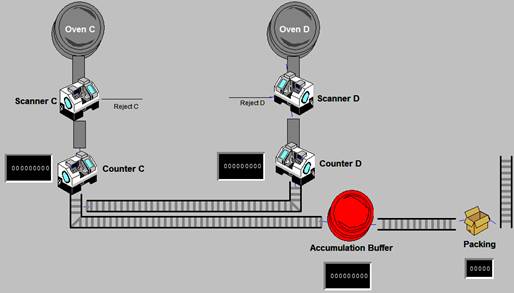
Figure 4 above
represents the Joy Cone layout as modeled in the ProModel program.
Each subsystem is labeled as either C or D, depending on the oven
location. Since the information
of most interest was in the simulation and the data collected through this
program, we felt that it was unnecessary to represent the correct icons for
the locations.
Table 3. ProModel Simulation
Results
|
Name |
Scheduled Time (MIN) |
Total
Entries (# of Entities) |
|
To Packing |
120 |
3521 |
|
Oven C |
120 |
3597 |
|
Counter C |
120 |
3529 |
|
To scan C |
120 |
3597 |
|
Scanning C |
120 |
3596 |
|
To Count C |
120 |
3530 |
|
Reject C |
120 |
66 |
|
Oven D |
120 |
3602 |
|
To Scan D |
120 |
3602 |
|
To Reject D |
120 |
71 |
|
To Count D |
120 |
3529 |
|
Merge Conveyor |
120 |
1764 |
|
Scanning D |
120 |
3601 |
|
Counting D |
120 |
3528 |
|
Overflow Buffer |
120 |
3517 |
|
To Shipping |
120 |
2148 |
|
Packing |
120 |
2140 |
The ProModel
simulation was run for a time period of two hours in order to collect data
on the number of entities the accumulation buffer location saw during that
time period. According to Table
3 above, the statistical results output by ProModel showed that the
accumulation buffer saw 3517 stacks of six cones during a two hour time
frame. This result was used to
help choose the size that the actual accumulation buffer would need to be
for our system. We chose to use
the ProModel data because we felt that having a large buffer size would help
account for any uncertainty in the production line.
As a result, it was found that an accumulation buffer size of 3600
stacks of six cones was sufficient for a storage buffer capacity.
Since two spiral conveyors are projected to be used, it can be
concluded that each spiral conveyor should store 1800 cones.