Project Depictions
Operation

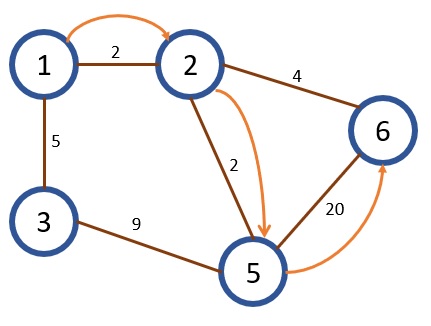
Above is a depiction of how the finalized network will function. The user begins by inputting the desired configuration options and confirming their selection. In this example the user has selected to use a greedy routing algorithm with latency as the metric with node 1 being the start node and node 6 being the end node. From here the control node will determine the most optimal path through the network with the given configuration. Each of the sensor nodes will have various weights on the paths between them which will influence the networks decision on routing. Due to these weights, the optimal path is from node 1 to 2, node 2 to 5, and node 5 to 6. The control node will send this data out to each of the sensor nodes and once that is finished it will perform a run. Once the run is completed the data collected will be transferred back to the control node and displayed to the user.
Sensor Node

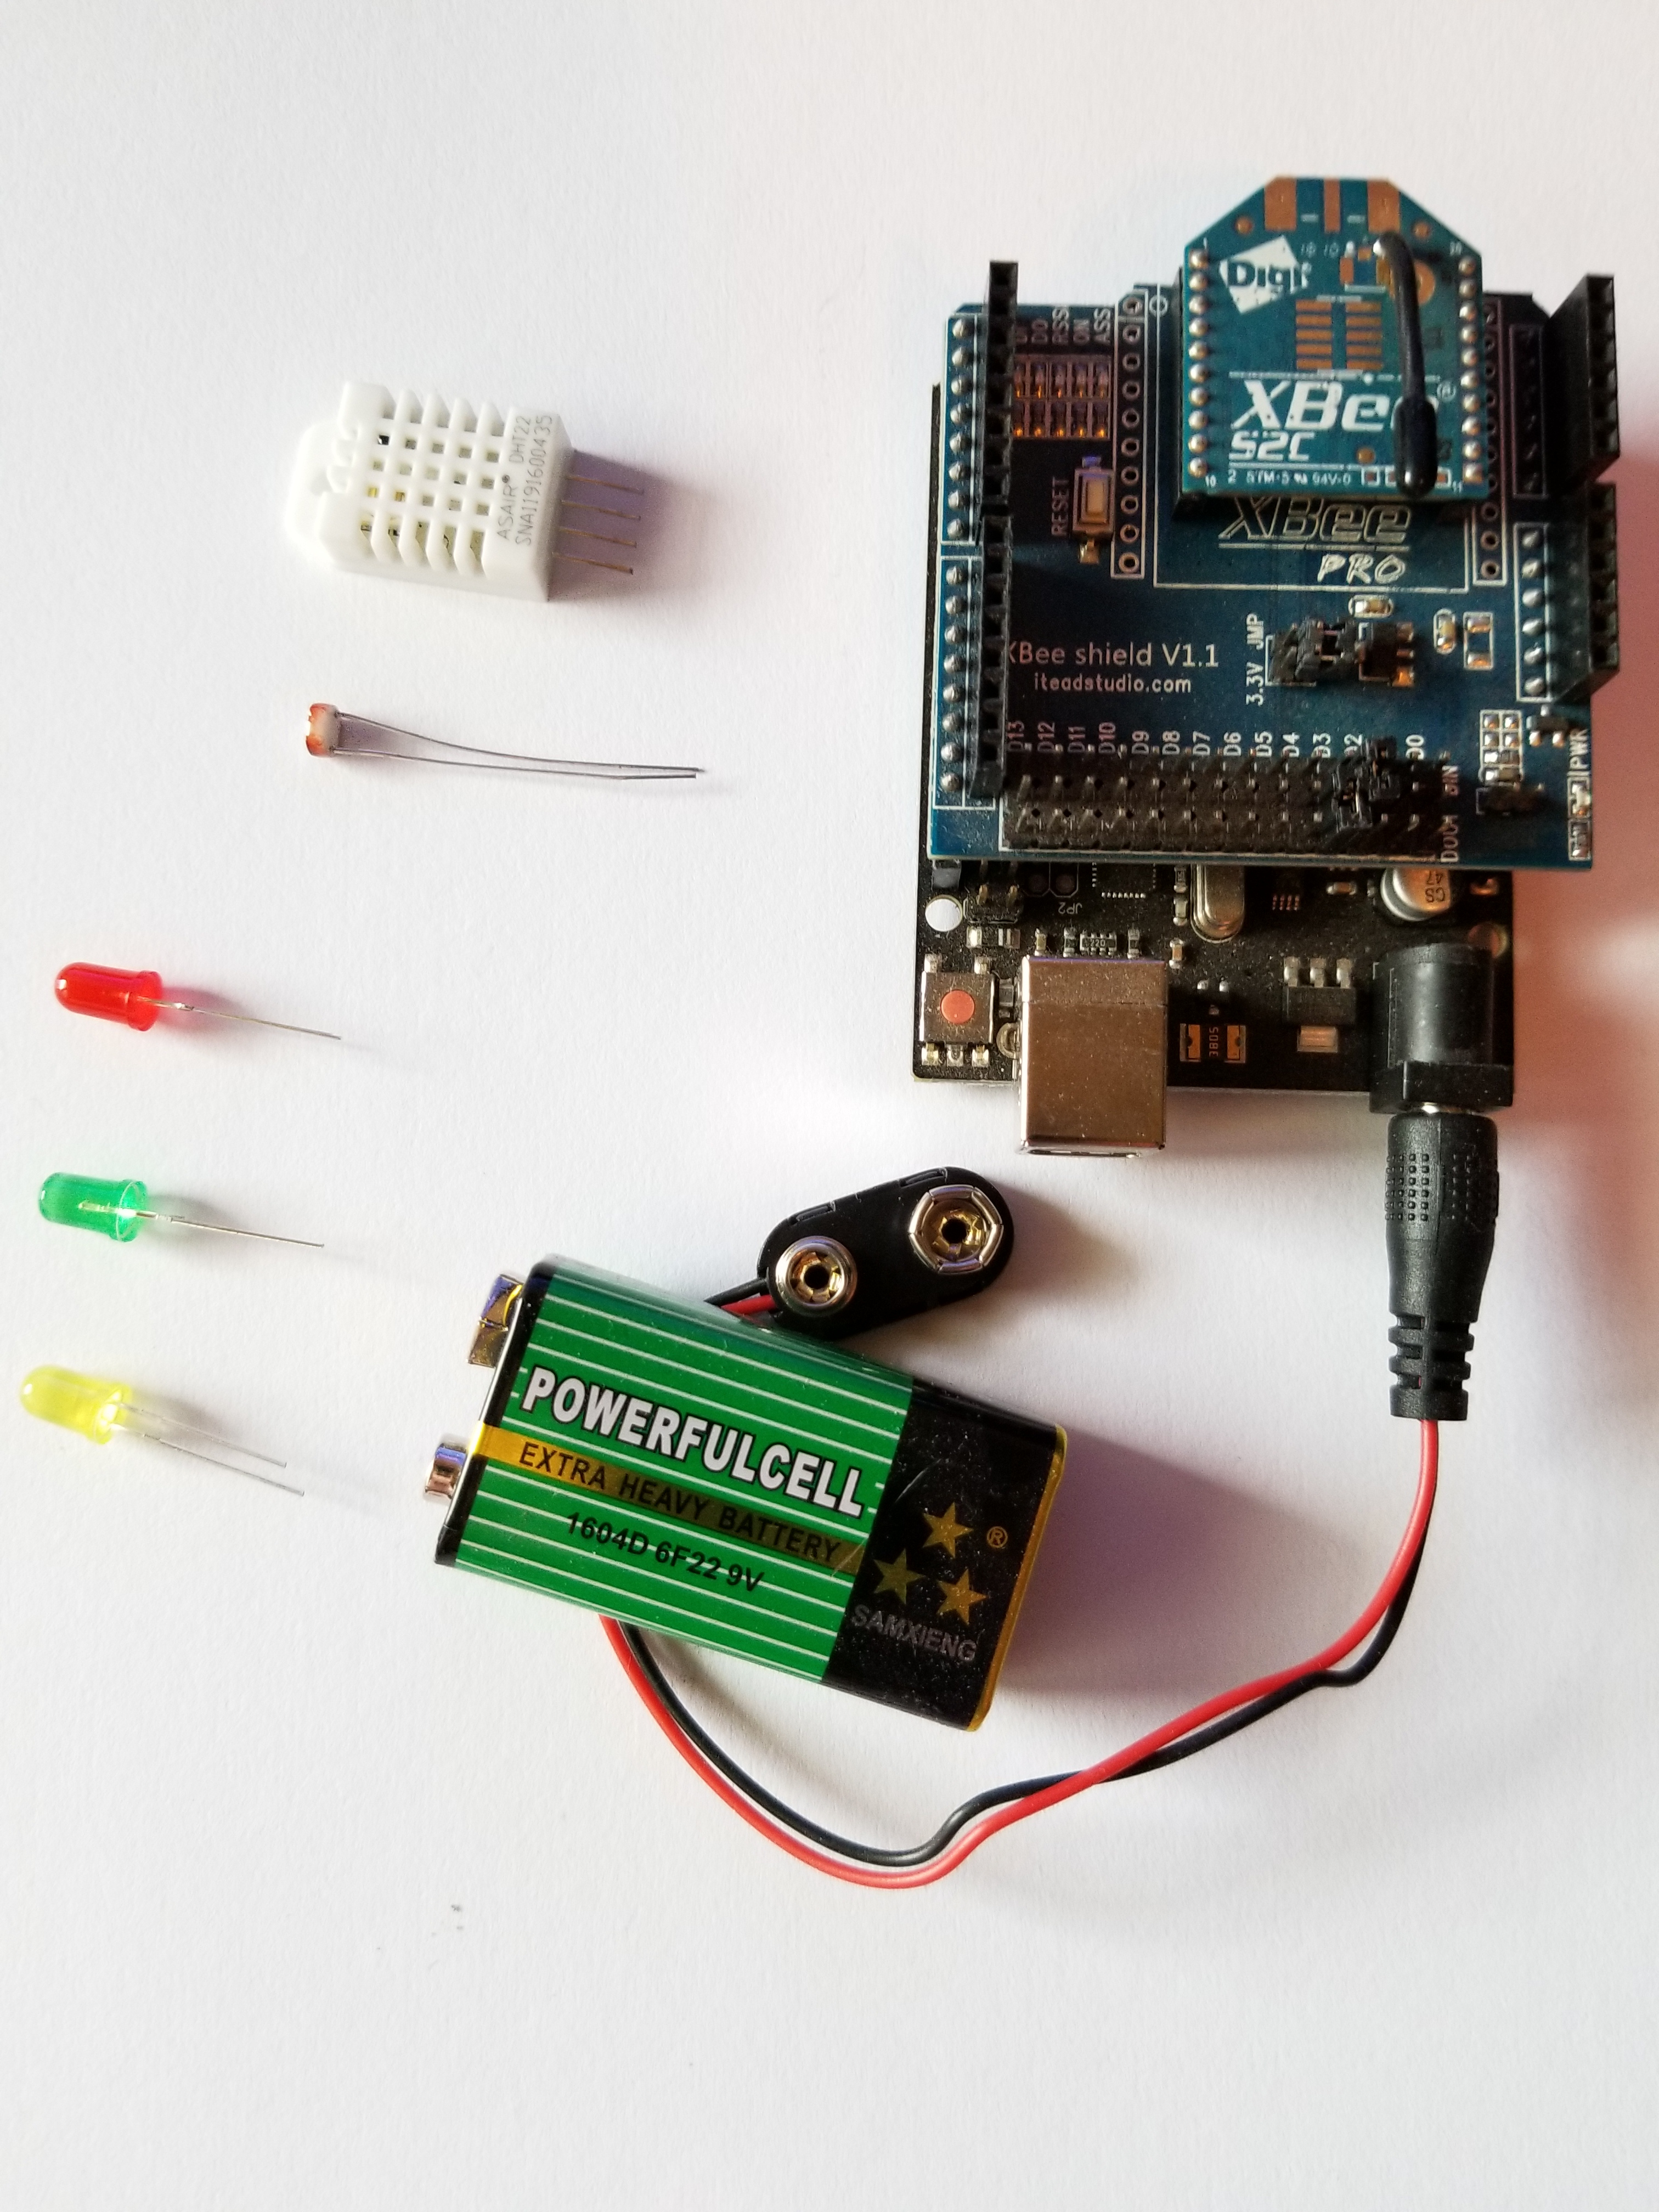
The image above is our sensor node with all of the hardware yet to be installed. The node itself comprises of an Arduino and Xbee radio module as the base. From here it will contain LEDs to show viewers the states that the node is in as well as two different sensors to collect data. One sensor is a dual humidity/temperature sensor and the other is a light sensor.
Control Node

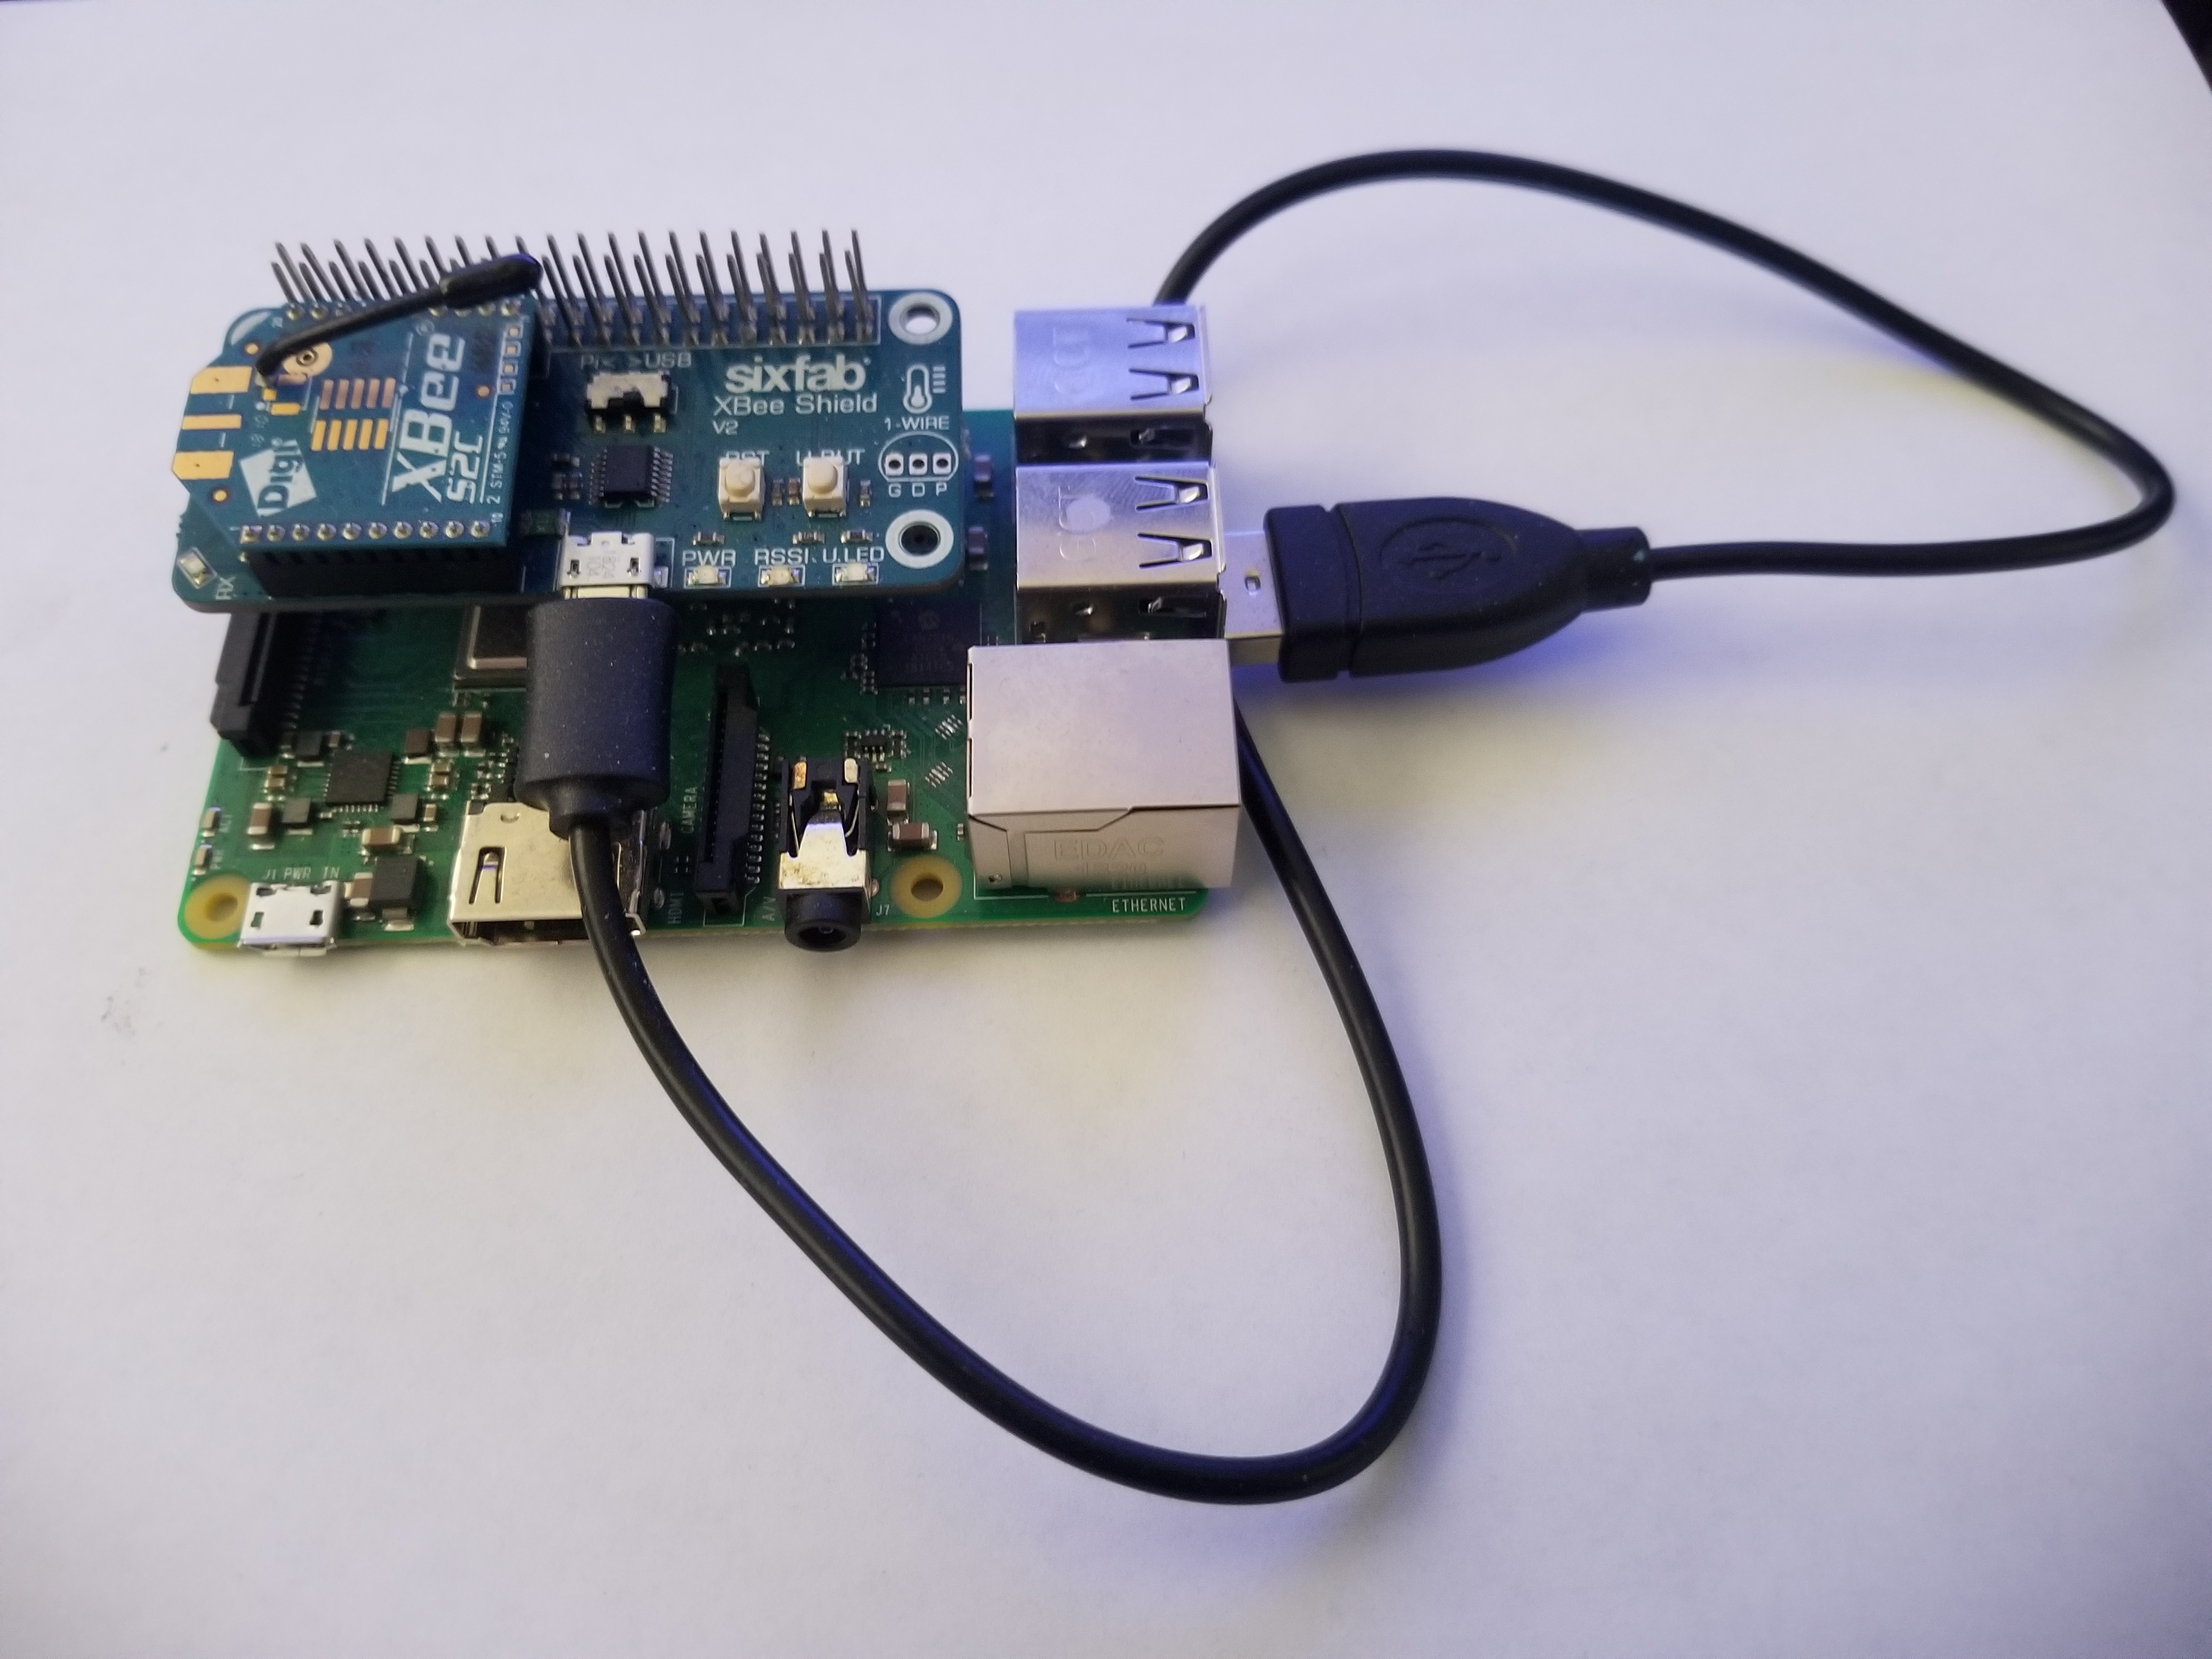
This image is of our control node. It is formed from a Raspberry Pi 3 B with a Xbee radio module attached to it. The control node uses the raspberry pi because it enables the node to handle the more complex computations required for communication.