Gantt Chart

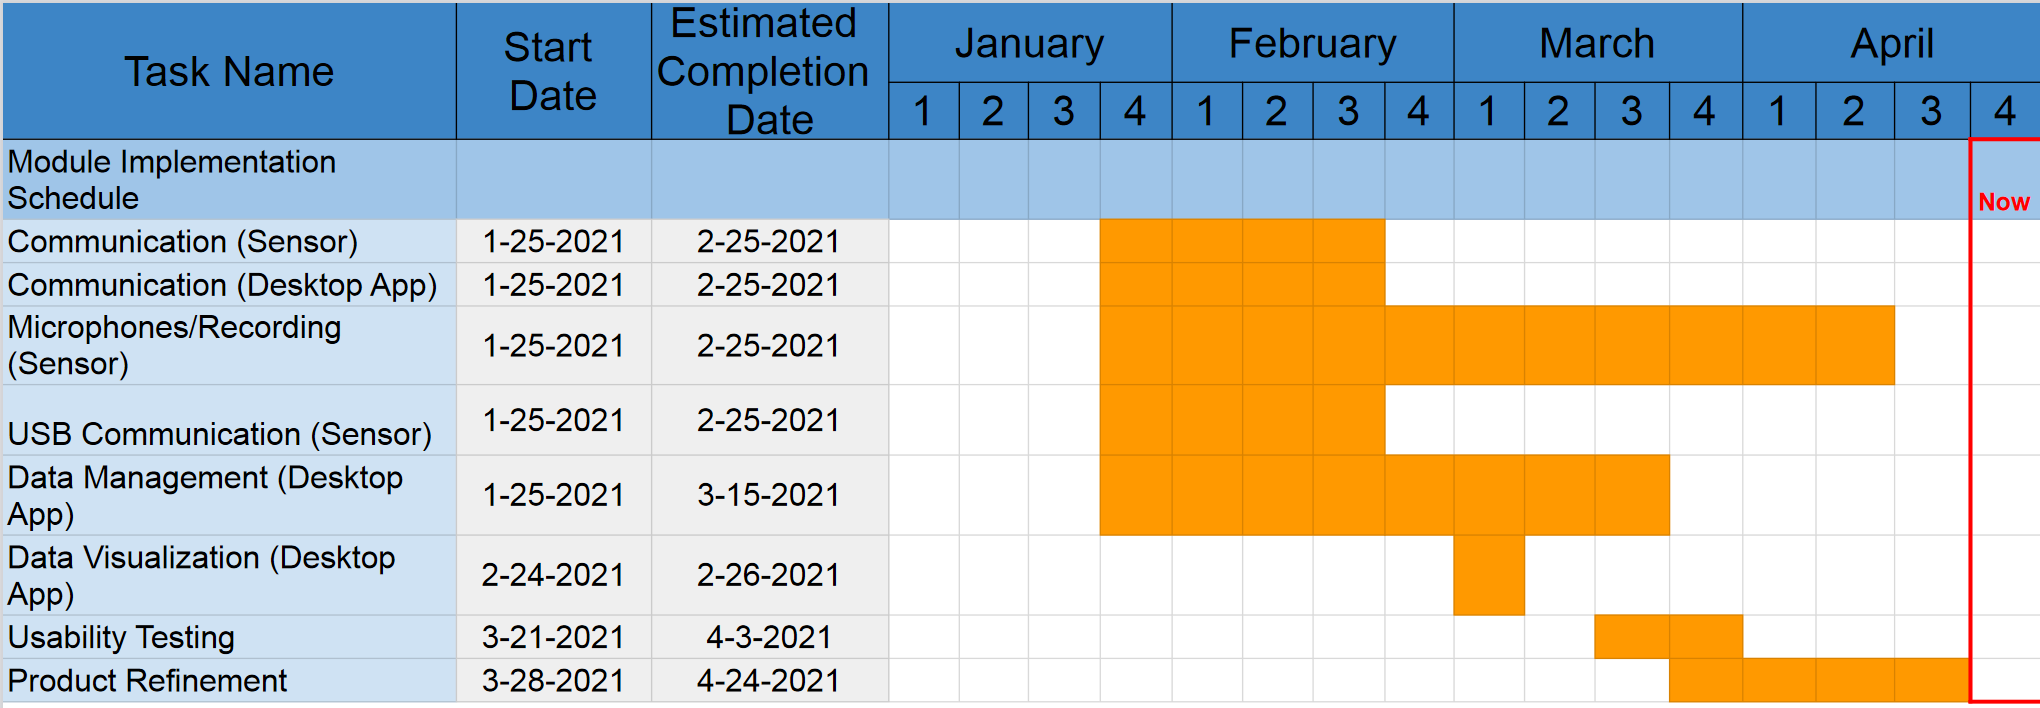
The above Gantt Chart displays our timeline for completing and researching the project. Our chart has changed throughout the year, and this is our most up-to-date Gantt Chart.
This Gantt Chart has a focus on completing modules as well as research for modules. This shows the main modules we have completed throughout the year to create a streaming mode which completes all of the requirements. Two of the major milestones we have completed is our Alpha Prototype and our Testing Plan.
This Gantt Chart has a focus on completing modules as well as research for modules. This shows the main modules we have completed throughout the year to create a streaming mode which completes all of the requirements. Two of the major milestones we have completed is our Alpha Prototype and our Testing Plan.