Our project is to develop an application for characterizing 3D vegetation structure in tropical ecosystems. We will analyze the data obtained from the Global Ecosystem Dynamics Investigation (GEDI). GEDI data is collected via lidar, laser ranging of forests and topography. The data consists of the 3D distribution of stems, branches, and leaves, making up the vegetation structure of ecosystems. GEDI is an Earth Ventures mission that started in December 2018 and is funded by NASA. GEDI will acquire billions of vegetation profiles across the Earth’s temperate and tropical ecosystems in two years.
The reason for launching this project is that the current workflow is clumsy and requires a lot of manual work. The goal is to create an application to help improve processing speed and accuracy while reducing repetition and manual steps. We envision an application that supports both researchers and policy makers. High quality analysis from our web application will make it easier for our end users to make decisions for conservation and resource management.
Our client’s current workflow is manual and coded in R. Our client would like GEDI data analysis to be accessible for everyone. With its current shortcomings, most users would not be able or willing to analyze GEDI data.
This system is failing to meet expectations as follows:
The user must directly process the data with R
Analyzing the data is currently tedious and complex
The output is provided in an esoteric layout
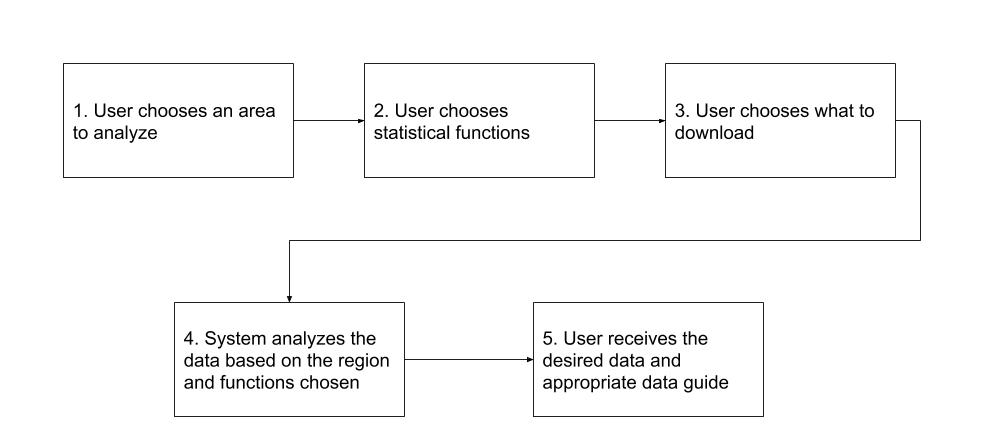
Our solution is to build a web application that allows users to understand the forest structure for a region that they choose. It will analyze the data for them based on the statistical functions they choose and help them understand the results. We will be doing the following as key project features:
The key tasks we have to accomplish are as follows:
