Field Sampling, Analysis, and Results
-
Field Sampling
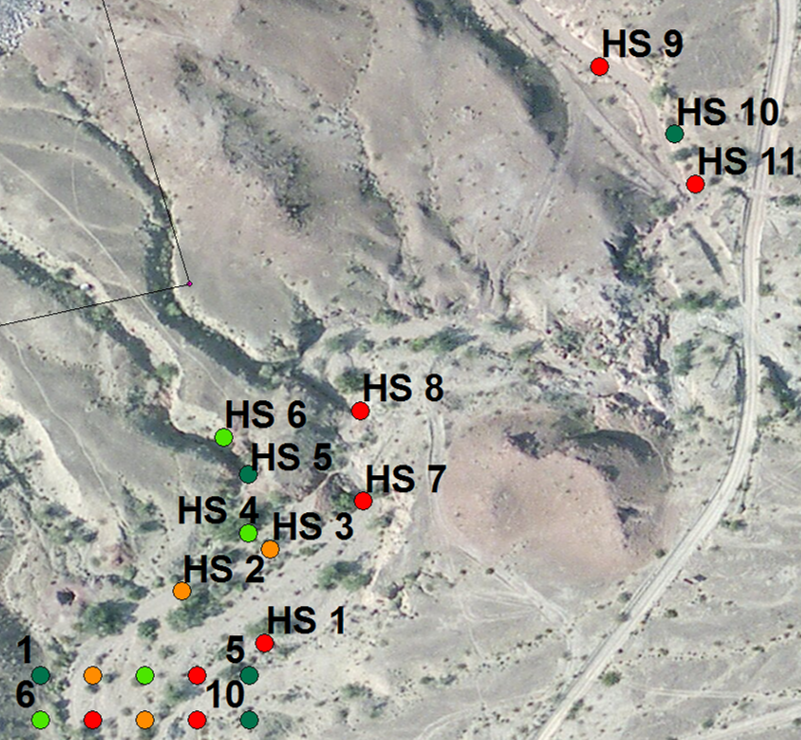
Sample collection procedures for the Red Cloud Mine Site Inspection followed the Sampling and Analysis Plan entirely. Eighty grab samples were collected in Black Rock Wash on the nodes of the grid seen in figure below. Eleven grab samples were taken from hot spots in varying locations in Black Rock wash and in tributary washes near the tailings pile. As per the Sampling Plan, hot spot collection locations were determined on site by Dr. Bridget Bero. These locations were chosen based on an assessment of the tailings pile and choosing locations in or around the wash where soil similar to the tailings was present or had potential to be present. In addition, three background grab samples were collected and two grab samples were collected down the wash approximately a quarter mile from the bottom of the grid. Every sample was collected using a clean trowel and a fresh pair of gloves in order to prevent cross contamination.
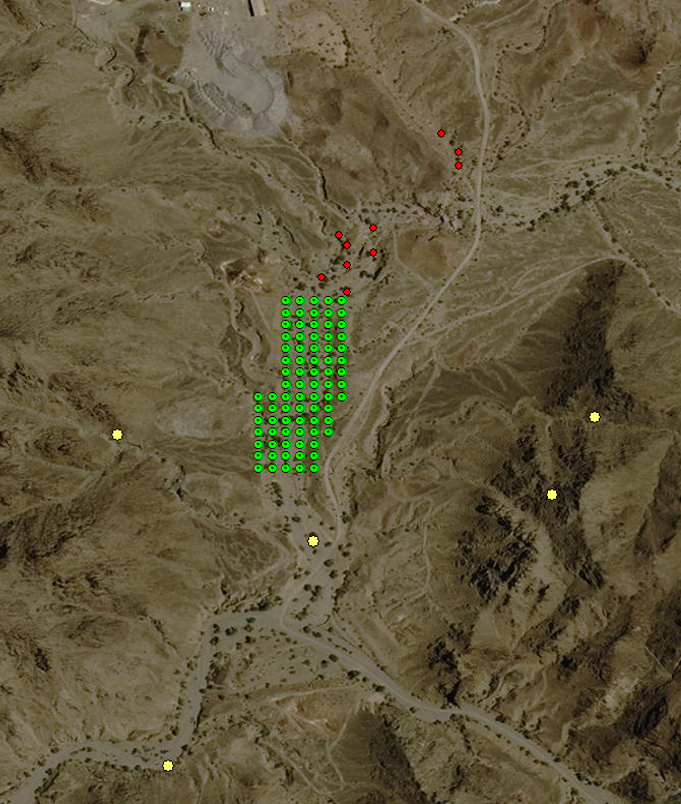
Location of Grid (green), Hotspots (red), and Background Samples (yellow)
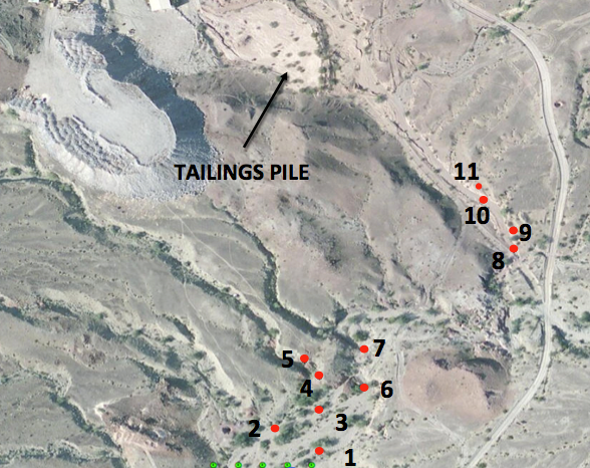
Location of Hotspots in Relation to the Tailings Pile
-
X-ray Fluorescence Analysis (XRF)
In order to perform a risk assessment for the site at Red Cloud Mine, accurate soil testing must be performed. This testing included X-ray fluorescence (XRF) and flame atomic absorption (FAA) spectrometry.
Directly after in-situ sampling, preparation for XRF analysis was conducted. Soil samples were removed from their gallon bags and poured into a sieve tower. After shaking, all of the soil that was passed through a no. 60 sieve was placed in a new gallon bag and was relabeled. This process assured better homogenization of the samples. All towers were then scrubbed with wire brushes, washed with soap and water, rinsed, and dried before each soil sample.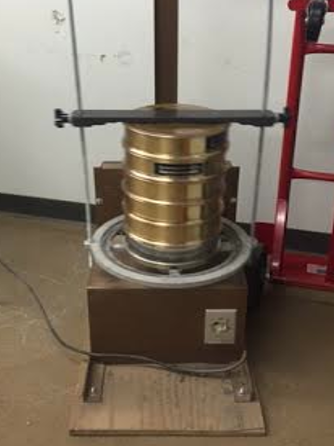
Sieving Stack, Photocredit: Kelsey Hammond
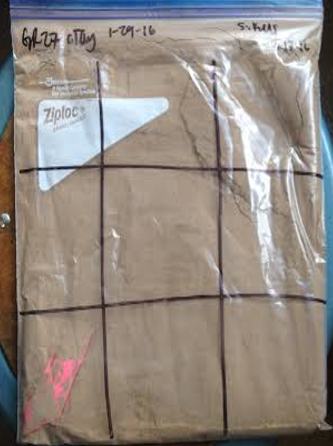
Each sample was then divided into 9 quadrants creating a 3x3 grid. An XRF reading was taken at the center of each quadrant, with the XRF measuring low, medium, and high concentrations at 30 seconds each for a total of 90 seconds.
Note: Although XRF is relatively accurate, it cannot give exact values due to small envelopes of error in the machine. This is due to the fact that analyte’s secondary x-rays may interfere with each other and the soil matrix may also add interferences. In order to get more accurate data, atomic absorption analyses were performed.
Example of XRF Sample Bag, Photocredit: Dani Halloran
-
Atomic Absorption Analysis (AA)
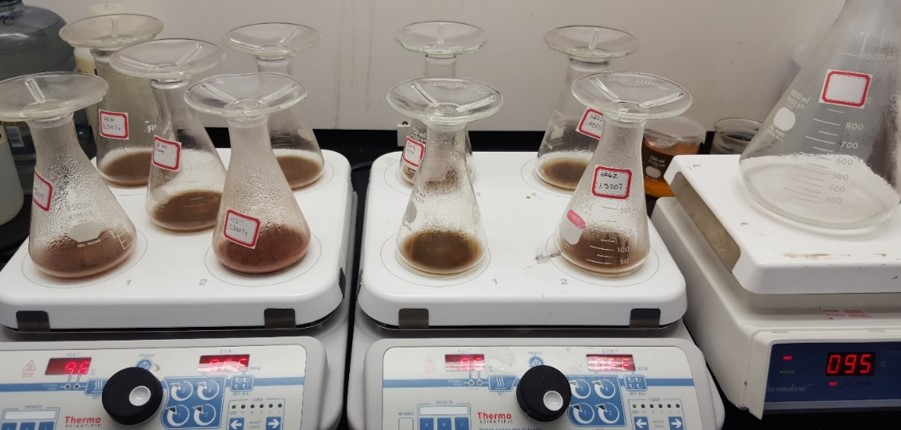
Twenty samples were selected for AA analysis and were prepped using EPA´s method 3050b for acid digestion. These samples were then sent to the NAU Chemistry lab for AA analysis by Jeff Propster. This analysis served to validate the accuracy of the original XRF data.
Atomic Absorption Acid Digestion Process, Photocredit: Dani Halloran
-
Results
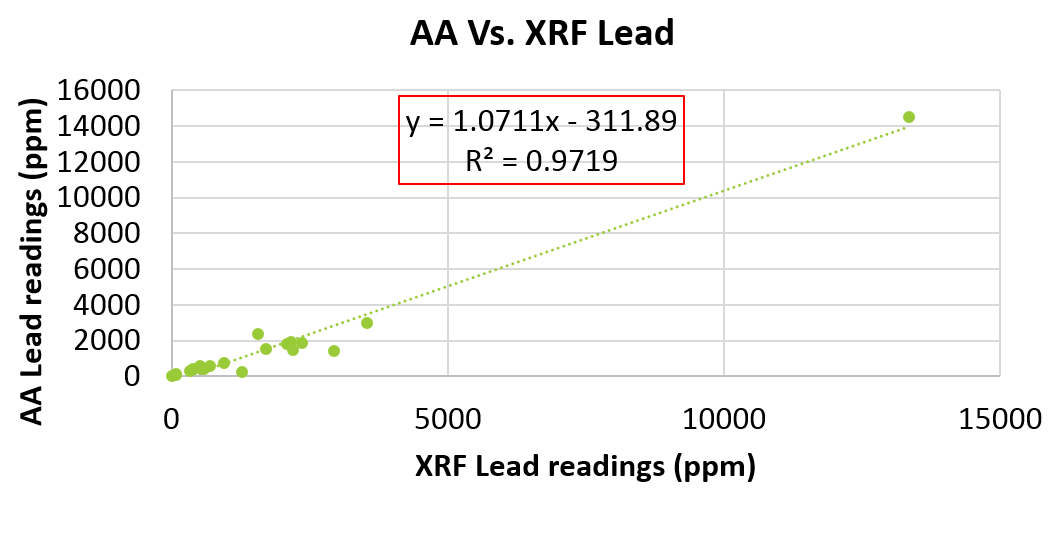
The results of the AA analysis can best be seen in the figure below which is a graphical representation of the AA data vs. the XRF data. The trendline associated with the graph and the R2 Value confirm that the XRF and AA data are closely related which confirms that the XRF readings are verified and can be used as fair and representative data.
Correlation of Data: XRF vs. AA
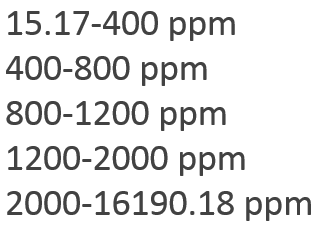
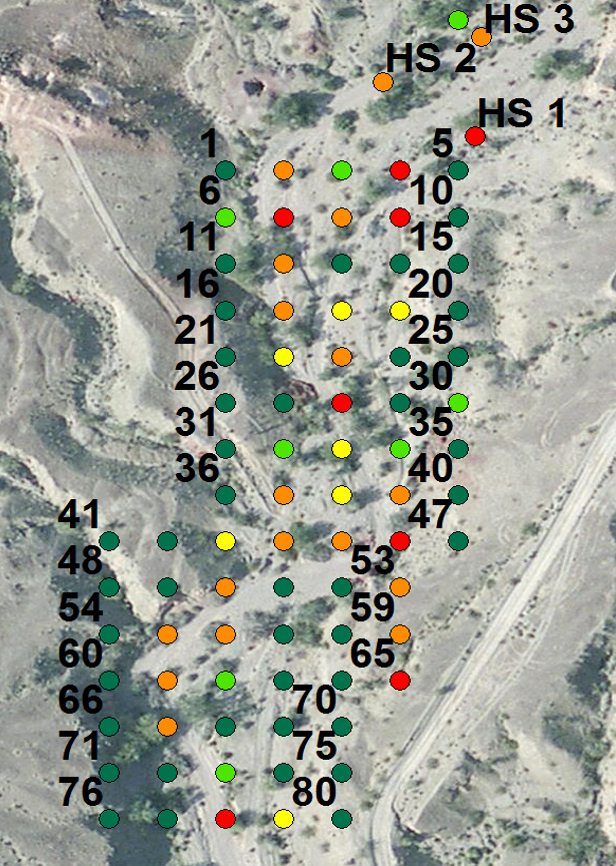
The results from the XRF included 9 concentrations of lead per sample. Of these 9 concentrations, the minimum and maximum reading were deleted, and the remaining 7 concentrations were averaged to find an average lead concentration for the sample as a whole. The following maps display a gradient color scale to represent the concentration profile of the site.
AZ Regulation 800ppm non-residential
EPA Regulation 1200ppm non-residential
Grid Results
Hot Spot Concentration Results
Not Shown: BK1: 88.27 ppm
BK2: 102.97 ppm
BK3: 29.15 ppm
DW1: 1535.38 ppm
DW2: 364.46 ppm
Last Updated: 5/6/16
